
Introduction
Maintaining good product margins is crucial to maintaining a healthy business. In the electronics business, customers have come to expect prices to drop every year. This means that I need to incorporate frequent cost reductions just to maintain margins.
Just to remind everyone, gross margin is defined as shown in Equation 1.
| Eq. 1 | 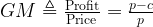 |
where p is the average selling price, and c is the unit product cost. We normally need to maintain margins above 40% to have a viable product.
I often say that all the interesting questions in life have the answer "it depends…." The same is true with cost reductions. Reducing the cost of a product requires some engineering activity. If you are working on a cost reduction, your engineering staff is not working on new products that will expand your market. So there is a balance that must be achieved between keeping your current product lines financially healthy and working on new products to expand your markets. Stated another way, working on cost reductions has an opportunity cost that must be balanced with the need for new product development.
We recently went through a quick evaluation of a potential cost reduction and chose not to implement it. The analysis that went along with this evaluation was interesting and worth documenting here. In the interest of confidentiality, I have changed all the numbers used in this example from the actual work example.
Analysis
Problem Description
The critical problem characteristics are described below:
- We are building 50K per year of a product (Q= 50K).
- The unit product cost is $150 (p=$150).
- We have identified a way to reduce the product cost by 10% (Δc%=10%).
- We work to maintain gross margins of 40% (GM = 40%).
- The cost reduction effort will require an investment of ~$150K (Ex = $150K).
- Net profit of 10% (NP% = 10%)
- The product has a life of about 2 more years after the development effort is complete.
After you have implemented the cost reduction, there are two approaches people normally discuss with respect to pricing:
- You can reduce your price and try to capture greater market share.
- You can maintain your price and increase your margin.
In my markets, neither of these options ever really occurs. What normally happens is that I see an erosion of prices every year because my competitors are constantly incorporating cost reductions. This means that I need to incorporate regular cost reductions just so that I can maintain my margins in the face of downward pressure on prices. So I am battling to simply maintain my margins and market share. This is the situation that I will be modeling here.
Decision Criteria
Most people use one of three financial measures to evaluate the worth of an engineering effort:
The approach that I will use here is payback time. The cost reduction is of less value to me the longer it takes to earn the profit needed to pay for the cost reduction investment. My approach is to compare the lost profit flow from not doing the cost reduction to the cost of implementing the cost reduction. This is a value measure that most people understand intuitively. NPV and ROI require more discussion and will be a topic of later blogs.
Some Economics
I need a way to estimate the impact of changes in product price on my annual shipment quantities. Economists have defined a term called the price elasticity of demand (EP) to model the impact of a price change. To understand elasticity, let's begin with a definition of price elasticity of demand from the Wikipedia.
- Elasticity
- The percentage change in quantity demanded in response to a one percent change in price (holding constant all the other determinants of demand, such as income).
The mathematical definition of elasticity is given below.
| Eq. 2 |  |
where
is the percentage change in yearly shipment quantities.
is the percentage change in average selling price.
To illustrate the use of EP consider a product and a market with an EP=-0.5. This means that a 10% reduction in price (Δp%=-10%) means a 5% increase in the quantity demanded (
Real companies almost never know very well how sensitive their shipment rates are to price. Usually, you end up guessing what the elasticity is. It turns out that the guesses are often pretty good. Years ago, I read Malcolm Gladwell's "The Wisdom of Crowds," which pushed the idea that groups of people have a form of collective wisdom that should not be underestimated. My experience is that his belief is correct.
Details
We begin our analysis by estimating the loss of annual shipment quantities if we cannot lower prices because we do not implement the cost reduction.
| Eq. 3 | 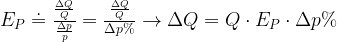 |
where
- Δp% is the change in price (10%)
- Q is our annual shipment quantity (50K).
- EP is the price elasticity of demand (-0.5)
- ΔQ is the change in quantity shipped.
From Equation 1, we can see that Δp% = Δc%. We can compute our change in revenue using Equation 4.
| Eq. 4 |  |
where ΔR is the change in revenue. The current price can be calculated by solving Equation 1 for p, which is shown in Equation 5.
| Eq. 5 |  |
In Equation 6, we see that the total profit flow, ΔP, can be computed from ΔR by using net profit (NP).
| Eq. 6 | 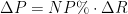 |
The money invested in cost reduction will be made up by retained profits in the time ΔT, which is given by Equation 7.
| Eq. 7 |  |
When we substitute the given values into these equations, we see that ΔT=24 years. With two years of product life remaining, we will never come close to recouping our initial investment. This cost reduction is not worth the effort.
Figure 1 illustrates the calculations.

Figure 1: Example Calculations.
Conclusion
We decided not to incorporate this cost reduction. Instead, we spent our time working on new products that will expand our existing market.