
Quote of the Day
The key to effective goal-setting is being realistic about what you can accomplish.
— Andrea Woroch
Introduction

Figure 1: A Typical 7.2 A-hr Sealed Lead Acid Battery.
It is difficult to dig trenches for fiber optic cable in many parts of the US and Canada during the winter. Thus, winter is the time of year when telecommunications companies do their planning for fiber optic deployments during the following spring, summer, and fall. This planning time is when the service providers see the large amount of money they spend on replacing bad lead-acid batteries, and they start to ask what they can do to reduce the failure rates of these batteries. These inquiries are about as predictable as the arrival of Christmas. Today, I received a more detailed question than I usually do and I thought my answer was worth documenting for a wider audience.
Background
Battery Construction
Figure 2 shows a video that does a nice job showing how batteries are built.
| Figure 2: Good Video Briefing on Battery Construction. |
Battery Life Reduction With Increasing Temperature
Today, I was shown this specification and asked to explain how battery life can change so much with temperature. Figure 3 shows the battery life graph that was the focus of this discussion.
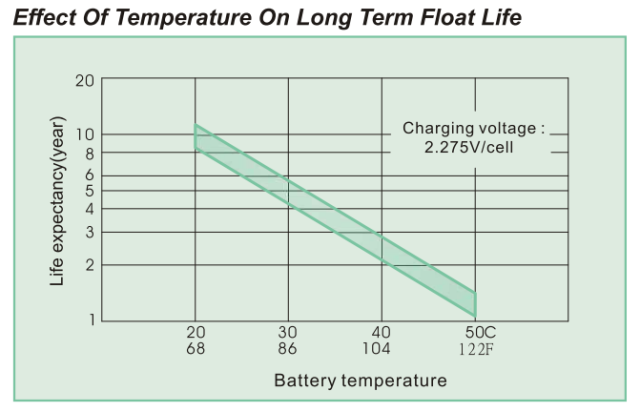
Figure 3: Battery Life Versus Temperature.
Figure 3 is a semi-log plot of the projected life of a 7.2 A-hr, Valve-Regulated Lead Acid (VRLA) battery versus temperature. Note that a range of battery lifetimes is given by this plot. This makes sense because battery lifetime will vary from unit-to-unit. Battery customers need to understand that battery life is not guaranteed -- you lifetime will vary based on the particular unit you have and how you treat it.
Failure Mechanism
Battery used in backup applications spend most of their lives at a float voltage. The main mechanism of failure in float applications is corrosion. Since I am not an electrochemist, I will simply quote a paper by a student of a battery expert:
The primary unavoidable aging effect is corrosion of the positive grid, composed initially of metallic PbO2, and is probably the most important factor for calendar life. This effect is also called grid growth because the electrode physically expands. [Wager] gives details on how the design of VRLA batteries can impact this fault mode, and on the chemistry of the process. In a nutshell, although we say that the positive electrode is composed of PbO2, this lead dioxide forms a dense corrosion layer around the metallic lead in the positive electrode when fully charged. This layer shrinks and expands during discharge and charge, and as it becomes fixed in a state of permanent corrosion, the grid is said to be corroded.
This quote is from this paper. Appendix A has a good infographic on how corrosion occurs.
While lead-acid batteries are simple at a high-level, there are many complexities when you start looking at the details of how they operate and eventually die. For a very good look at the details of battery chemistry, see this paper.
Analysis
Failure Analogies to Self-Discharge
VRLA batteries in backup applications maintain their batteries at a float voltage level, usually between 13.6 V and 14.4 V. You often see batteries described as having a life of 300-500 discharges. But what does this mean with respect to a backup power application where the battery is rarely discharged? Batteries in backup applications do fail, usually by damage caused by corrosion and not by charge/discharge cycles. This corrosion is a chemical reaction similar to the reactions that cause self-discharge, which I discuss at length here.
Standard Reliability Model
Equation 1 show the model used by most VRLA battery vendors. Unfortunately, the vendors use different values for T0 and T1, which means that you have to be careful about making direct comparisons.
| Eq. 1 | 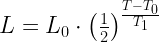 |
where
is the expected device lifetime at the reference temperature
.
is the temperature increase required to halve the expected lifetime of the device.
- T is the actual operating temperature. Note that few batteries spend their entire lives at a constant temperature. I will address the variable temperature case in a later post.
Equation 1 is actually an approximation based on the Arrhenius equation. I review the details of this approximation here.
Model Characteristics For Figure 2
Equation 1 can be used to generate the curve of Figure 1. The required parameters are:
I did not need to do any analysis to make this determination. The battery is rated to have a nominal life of 10 years at 20 °C and you can see that the life halves every 10 °C. You can read these values right off of the graph.
IEEE Approach
Note that Figure 3 describes a situation slightly different than that presented by the IEEE (Figure 4). IEEE Standard 450-2002 for lead-calcium alloy VRLA batteries sets T0 = 77 °F and T1 = 15 °F. Minor differences between models like this are not surprising -- batteries are all built slightly differently, and these difference will affect their expected lifetime.
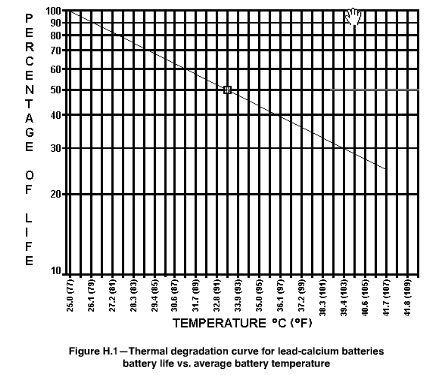
Figure 4: IEEE Thermal Degradation Curve for Lead Calcium Batteries.
People always seem surprised that lower temperatures mean longer battery life -- it is true. However, the capacity of the battery is reduced over its nominal value (i.e. Amp-hr capacity @ 77 °C). This means that customers in cold climates may need to have larger battery packs (i.e. higher capacity) to provide the backup time they need under cold conditions.
Conclusion
This is just a quick note to document some of the material I went through today. I do have anecdotal evidence in support of Equation 1. Our customers in hot climates (i.e. Texas) that use outdoor batteries see relatively short lifetimes. We also have customers in cold climates (i.e. northern Minnesota) who have had good battery performance for long past their nominal ratings.
Appendix A: Good Battery Sludge Generation Infographic.
Figure 5 shows a good infographic on how battery sludge builds up in a battery (Source).

Figure 5: Infographic on Battery Sludge Generation.
Pingback: Battery Life Dissipated Under Varying Temperature Conditions | Math Encounters Blog
Pingback: Battery Room Ventilation Math | Math Encounters Blog