Introduction
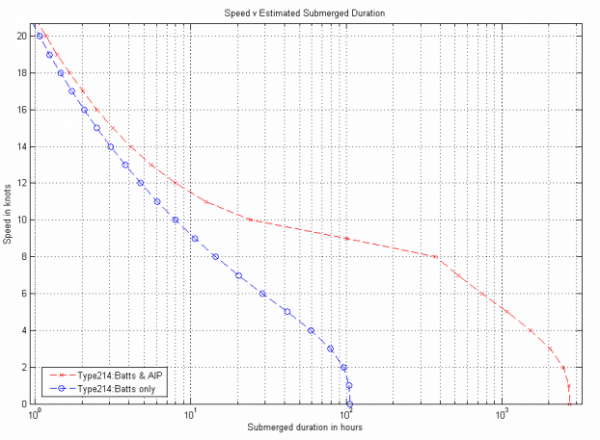
Part of my job is looking at backup power sources for remote telecommunications gear. I recently have been doing some reading on fuel cells, which we are starting to see in some backup power applications. I started googling to see if I could find other fuel-cell applications and I found a paper on fuel cell usage in modern diesel electric submarines. This paper contained the following graph (Figure 1).
Figure 1 shows this submarine's submerged running time at a given speed for battery-only (blue line) and battery plus fuel cell power (red line). I am going to focus on the battery-only power curve in my discussion here.
In an earlier post, I reviewed a video by John Barrow on the dimensional analysis of Olympic rowers. I am going to expand that discussion and show how it applies to Figure 1 and submarines. It turns out that rowers and submarines have a lot in common.
Problem Description
Submerged underwater vehicles are powered by energy sources that do not require air. Excluding nuclear power, which is only an option for the military of a major power, batteries have been the most commonly used energy source. Unfortunately, batteries have a low energy density and they tend to be big and heavy (i.e. most submarine batteries use lead-acid chemistry). Because underwater propulsion is all about energy, the key Figure of Merit for an underwater propulsion system is its total available energy.
While energy is the critical parameter in underwater propulsion, it is frequently seen in a hidden form. For example, consider the table shown in Figure 2, which is from a US Navy historical web site. It contains a common nautical FOM, R·v2.
This FOM is really just a way to state the propulsion energy present in the system. Figure 3 illustrates how to derive this relationship.
The analysis of Figure 3 tells us the energy expended to move through the water, but it does not represent the total energy expended because it does not include any inefficiencies in the system associated with generating that motion. In the case of rowers, to put a given amount of energy into moving a boat through the water you must actually start with more energy because there will be losses. For example, some additional energy is required to keep the rower's bodies functioning and to generate waves. In a submarine, some energy must be expended for life support and operating its control systems (e.g. navigation, steering, sensors). The following analysis will assume that the drag force on a submarine is proportional to its velocity squared and that the submarine has a constant power load that adds to its propulsion power usage.
Analysis
My analysis process is simple:
- Model the submarine power usage as a combination of propulsion and non-propulsion loads
- Capture submarine performance data in Figure 1 so that I can analyze it.
- Plot the actual submarine performance against the load model to see how it compares.
I was pleased with how well this model was able to match the empirical data of Figure 1.
Model of Submarine Propulsion and Non-Propulsion Load
Since Figure 1 shows submarine speed versus time, we need to develop a relationship between submarine energy and speed. The US Navy FOM discussed above relates speed to range. However, range = speed · time, so we can develop another relationship as shown in Figure 4 below.
We can now augment this model with a constant non-propulsion power load (called the "hotel load"). The derivation in Figure 5 illustrates my modeling approach.
Submarine Speed Versus Run Time Curve Capture
I captured the data from the online pdf using Dagra and put that data into Mathcad. Figure 6 shows the result.
Combined Loss Model and Comparison with Reality
In Figure 7, I have a comparison of my fitted model with the actual submarine performance curve. If I assume that PHotel/k = 83, I get an almost exact fit.
In Figure 7, we see how ignoring the hotel load gives a reasonably close approximation, but including the hotel load makes the model prediction almost identical to the empirical data.
Conclusion
While a bit complicated, this post shows that the analysis used to model the performance of an Olympic row boat applies to a submarine if losses are included.


Just a clarification question - what units did you use for your fitting parameter Ph/k? Are you staying with kW and knots or did you switch to SI?
Pingback: WW2 Submarine Endurance on Batteries | Math Encounters Blog
Pingback: WW2 Submarine Endurance on Batteries | Math Encounters Blog