I have had some questions recently on the power conversion efficiency of AC power adapters (aka "wall warts"). I think my customers are becoming more concerned about energy costs. The questions that I received focused on how the efficiency of a wall wart varies with how heavily it is loaded (load factor = actual load/maximum rated load). For example, a wall wart rated for 20 W but driving a 1 W load would be considered lightly loaded (load factor = 1 W/20 W = 5%). The same 20 W wall wart with a 20 watt load (load factor = 20 W/ 20 W= 100%) would be considered heavily loaded.
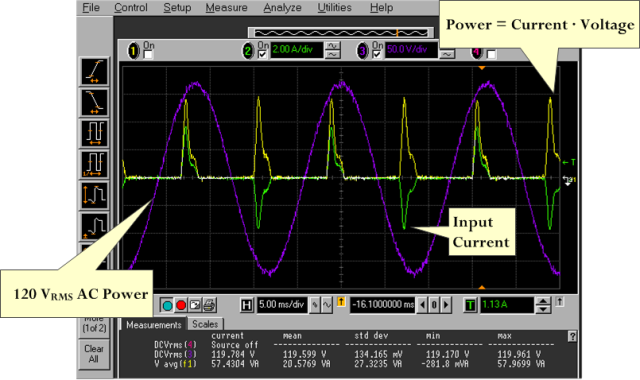
I did a quick search of the web and I could not find any conversion efficiency data for standard wall warts. Fortunately the measurements are simple, however there is one interesting aspect -- the input current is very non-linear. This means that I must do a numerical integration of the instantaneous power (= input current times input voltage) to determine the average power. This actually is simple because multiplying signals and integrating them are built-in features of today's oscilloscopes. Figure 1 shows an oscilloscope screenshot of the wall wart input voltage, current, and power.
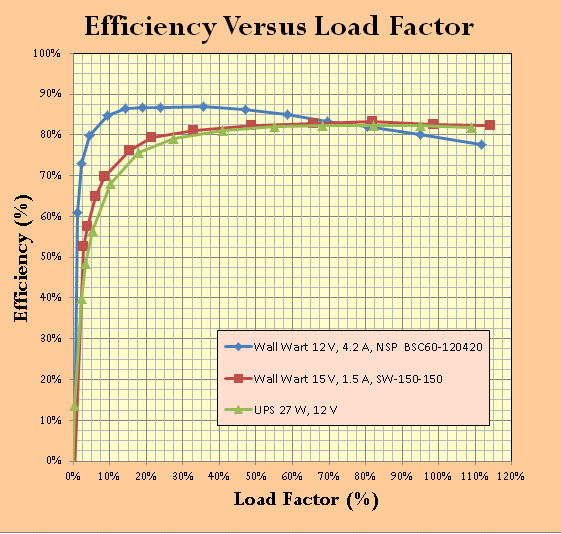
Figure 2 contains my graph of the efficiency versus load factor (load factor = actual load/rated maximum load). For comparison, I added a plot of the efficiency of a very common UPS to the plots for the wall warts.
The plots show that wall warts have relatively constant conversion efficiency when loaded at 30% or higher.
Note:
Here is a discussion of wall-wart power conversion efficiency by the NRDC folks.


Pingback: Computing Useful Customer Analogies | Math Encounters Blog
Hey there! I was curious if you knew which of the wall warts you tested were linear and which were switching. Thanks! Guisepi