
Quote of the Day
If you want to succeed you should strike out on new paths, rather than travel the worn paths of accepted success.
— John D. Rockefeller
Introduction
I need to do a quick calculation of the Crest Factor (CF) for various types of Quadrature Amplitude Modulation (QAM) signals. CF is important to a hardware designer because higher CF values generally means more expensive components in order to meet the demand for high peak currents (or voltages) relative the the power delivered. As always, I first went to the Wikipedia to check out what they had on the subject. Unfortunately, the Wikipedia's article on CF only listed the QAM-64 CF (Note - I have since updated that Wikipedia page). Looks like I will need to compute the CFs for the other QAM options that I am interested in. I am sure they are in a reference somewhere, but I am short of time.
While performing this calculation, I decided to see if Mathcad's symbolic solver could give me a general equation for the CF of a QAM signal with a perfect square number of signal symbols (i.e. QAM-N2). It gave me a reasonable result that also produces a result for QAM-∞ that is the same as is listed in the Wikipedia.
Background
As far as information on QAM, Wikipedia's article on QAM is better than anything that I could write here.
The calculation on CF for a QAM signal is straightforward. Engineers normally discuss QAM signals in terms of a constellation diagram. Figure 1 shows a constellation diagram for QAM-16.

Figure 1: QAM-16 Constellation Diagram from Wikipedia.
Crest Factor is defined as shown in Equation 1.
| Eq. 1 |  |
where
- CF is the crest factor of the signal x (unitless)
- xRMS is the RMS value of the signal x.
is the peak of the signal x.
CF can be computed for either currents or voltages. My focus here will be on voltages.
Analysis
Computational Approach
I need to compute the CF for QAM-4, QAM-16, QAM-64, and QAM-256. If I assume that all signals in the constellation are equally probable, the calculation is straightforward. Figure 2 shows my calculation in Mathcad. The numerator of my CF calculation is the maximum amplitude of the set of possible QAM signals. The denominator contains the RMS calculation for all the possible QAM signals assuming that they are equally likely. I also can ignore the absolute amplitudes of the various QAM signals because I am working with ratios.

Figure 2: Screenshot of my Mathcad Calculation of QAM Crest Factors.
These values make sense (i.e. agree with what I know to be true for QAM-4 and the Wikipedia entry for QAM-64). Figure 3 shows a plot of CF versus QAM constellation size.

Figure 3: Crest Factor Versus Constellation Size.
Symbolic Analysis
I took the formula shown in Figure 2 and assumed a symbol number of N2, where N is an even number. Figure 4 shows the result of this symbolic analysis.

Figure 4: General Solution for Constellations with N2 Symbols.
Note that for constellations with a large number of symbols, the CF approaches 
Conclusion
Quick, simple calculation that solved my problem. I have added three appendices:
- Appendix A that includes examples of square and non-square constellation configurations.
- Appendix B shows one way of computing the crest factors for both square and non-square constellations.
- Appendix C shows an excerpt from a reference that derives the same general equation as presented here.
Appendix A: Constellation Examples
Figure 5 shows some constellation examples. Note how the non-square constellations have their corners cutoff. Other configurations are possible and each will have different crest factors.

Figure 5:QAM Constellation Examples.
Appendix B: Crest Factor and PAR Calculation for Non-Square Constellations
Figure 6 shows an example of how I computed the crest factor and PAR for both square and non-square constellations. Calculations are more tedious for non-square constellations because of the need to manually cutoff the corner points.

Figure 6: Alternative Calculation that Handles Square and Non-Square Cases.
These numbers agree with the table included in this here.
Appendix C: Reference that Discusses Crest Factor for Square Constellation Sizes
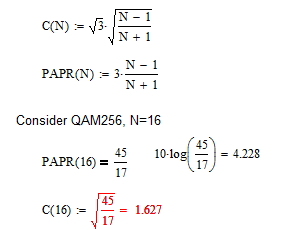
Figure 7 shows a reference that I found that presents a general formula for Peak-to-Average Power Ratio (PAPR), which equals CF2. The answers are the same as I present here.

Figure 7: Statement of General Solution for Square Constellations.
If I'm reading this correctly, on your Mathcad equation, the denominator is calculating the average magnitude of the vector. I believe that the square root should be pulled inside the summation symbols.
Also, this equation is not true for non-square constellations. For example, QAM32 has a much lower crest factor than your graph would indicate.
Hi Alan,
Thanks for your comments. I actually am computing the RMS value of the constellation, so the square root should stay outside of the summation. Just to make sure I was performing the calculations correctly, I surfed around to see if anyone else had done a similar analysis and it turns out a number of folks had done so with similar results. I have attached two of those analyses to this post (one a figure and one a PDF).
I do agree that QAM-32 has a lower crest factor. It really is because the constellation has the peak power points removed from each corner of the constellation. This makes the crest factor lower. I have updated my figure to reflect this fact. I have also attached an analysis that includes the non-square constellations. I have also included an appendix with example of the constellations for square and non-square (QAM-32 and QAM-128) cases.
Mathscinotes
Very nice and elegant. Respect.
I see some problems with your calculations. Notice the tabulated Crest Factors in figure 6 match the PAPR in the figure 7. From your description the PAPR should be 2x bigger because for the power ratio you would be using 20*log not 10*log.
I do not believe your statement is correct. In Figure 6, f(θ) is being computed using power (notice squares with no square roots), so 10log(PAPR) is correct.
mathscinotes
If you look at the values you have the same numbers. For crest factor and papr. PAPR should be the crest factor squared.
That I agree with and will correct.
mathscinotes
Actually, as I look at it more I think what I have is correct. Please look at my analysis here. Figures 6 and 7 agree and my CF squared is PAPR.
Your figure 6 is talking about crest factor but figure 7 seems to be talking about PAPR not crest factor. So it might be that figure 7 is mislabeled.
I state in the intro paragraph to Figure 7 that "presents a general formula for Peak-to-Average Power Ratio (PAPR), which equals CF2". So I acknowledge it is not CF, but is instead CF2.
mathscinotes.
If you look at the values in the table of figure 7 the ratios are the same as you have in the crest factors in figure 6.
I also have another question. The equivalence of CF and PAPR=CF^2 does not make since because the PAPR for a sinusoidal signal with no modulation or only phase modulation should be 0dB but the crest factor listed for for a sine wave is 3dB. But the PAPR would be 0dB as listed for the QPSK signal as found in figure 6.
As far as a sine wave goes, the CF = 1.414, for which 20log(1.414) = 3 dB. This does make sense because the crest factor is about voltage (or current) levels -- PAPR is about power. The CF and PAPR values for QAM are not the same as a sine wave because there are 4 components in the constellation.
One other example from Micheal Steer's book "Microwave and RF Design" page 670 table 11-10 list the PARPR of 64-QAM as 7.8dB where as table 1 in figure 7 shows it to be 3.7dB for PAPR. So it appears that table 1 in figure 7 is incorrect. I don't see a problem with your Crest factor in figure 6.
I have Steer's book and have worked with it before. I believe that Steer's book is computing something slightly different than I am, hence the difference. I am computing a theoretical number here with no efficiency degradations for implementation method. Steer is including efficiency reductions assuming a class A amplifier.
The PAPR for sine wave is 0dB not 3dB, unless the sine wave is modulated.
The Wikipedia lists the crest factor of a sine wave as 1.414 and the PAPR as 3.01 dB.
In regard to your table for QAM16 PAR = 2.6dB :
From my R&S SMJ100A Vector Signal Generator, QAM16 100Msyb/sec, Gausian Filter, there are two fields that define the signal level, i.e. @ Level [10dBm] = PEP [14.56dBm].
I have confirmed this with PEP the FSQ Spectrum Analyzer, FSQ measured PAR of said stimulus is 4.55dB (0.1% probability).. Can you explain the 2dB (2.6dB - 4.6dB) PAR discrepancy between your calculated PAR vs. my measured?
Regards,
Tony
No idea as to the cause of the difference.
mathscinotes
Don't you think the trajectory of the signal will increase the peak value? Which in its turn will increase the CF. The trajectory can be obtained by interpolation of the signal at a higher rate than the symbol rate.
trajectory definitely will impact CF/PAR.
from the calculation, the CF/PAR of QPSK/4-QAM signal is 0. But in real application, definitely CF/PAR is not 0.
Useful for busy people ! Thanks !
equivalently, PAPR[N^2-QAM] = C^2 = 3(N-1)/(N+1) (for square QAM)
For N=8 we have PAPR[64-QAM] = 7/3
'Wiki Crest Factor' yields C= Sqrt[7/3], consistently, so I believe your formula.
Also PAPR[4-QAM] = PAPR[2^2-PAM] = 3(2-1)/(2+1) = 1 (the power of all symbols is constant)
so I believe it even more 🙂
This is THE formula !