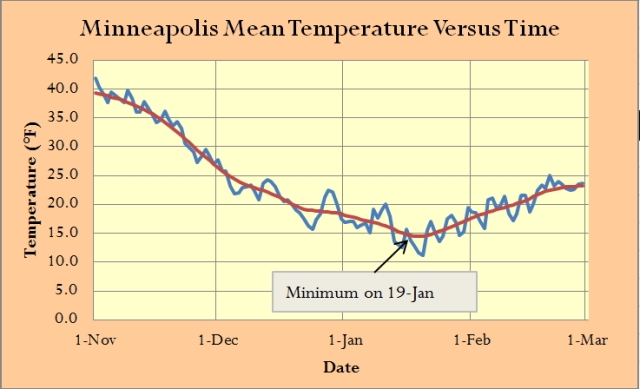
We are going through a some very cold weather now in Minnesota. During late January, I start to daydream about warm weather. While daydreaming about going to my lake cabin today, I started to wonder when the average daily temperature in Minneapolis begins to increase (Minneapolis is the nearest large city to me). So I decided to go out to the Weather Underground and download the Minneapolis weather data since 1990, compute the daily averages, and smooth the data. I plotted this data in Figure 1. The minimum average daily temperature occurs on the 19th of January. So our daily average temperature is now increasing. That makes me feel like warm weather is not too far away.
Days Postings
Blog Series
Copyright Notice
© Mark Biegert and Math Encounters, 2024. Publication of this material without express and written permission from this blog’s author and/or owner is strictly prohibited. Excerpts and links may be used, provided that full and clear credit is given to Mark Biegert and Math Encounters with appropriate and specific direction to the original content.
Disclaimer
All content provided on the mathscinotes.com blog is for informational purposes only. The owner of this blog makes no representations as to the accuracy or completeness of any information on this site or found by following any link on this site. The owner of mathscinotes.com will not be liable for any errors or omissions in this information nor for the availability of this information. The owner will not be liable for any losses, injuries, or damages from the display or use of this information.

