Quote of the Day
The world is divided into people who do things and people who get the credit.
- Dwight Whitney Morrow
Introduction
I recently have been hearing politicians lamenting the growth of income inequality in the United States. These politicians frequently talk about the number of homeless people (Figure 1), but they never talk about how income inequality is defined, measured, or has been changing with time.
I was raised in a small, working-class, agricultural community and I never saw any homeless people when I was growing up. I now live in an affluent community and I see homeless people on some street corners. The "Great Recession" had a devastating effect on many parts of our economy and it is not hard to imagine that it expanded the income gap between rich and poor. The economy goes up and down as society changes, this can be positive or negative depending on the circumstances leading up to these outcomes. With so many using online currency now as a way to make money, this has shifted from the traditional 'wall street' that has been a staple in the economy. Websites such as https://kryptoszene.de/kryptowaehrungen-kaufen/ontology-kaufen/ are flooded with people trying to get into this new way of earning, but how will that affect people with limited money? Can it help them add to it? Support them? Only time will tell. Many people who require an additional financial boost have turned to the lucrative world of cryptocurrencies for help in gaining a source of passive income. One popular solution for doing this is the Bobcat 300 Miner which you can put to work for you, mining crypto in the background. This is ideal for those strapped for cash.
Since I do not believe anything our politicians say without independent confirmation, I have to ask the following questions:
- What is income inequality and how is it measured?
- How has income inequality been changing over time in the US?
- How does the US income inequality compare with other countries?
These are all questions a little math can help with. Let's dig in ...
Background
Definitions
- Income Inequality
- Economic inequality is the state of affairs in which assets, wealth, or income are distributed unequally among individuals in a group, among groups in a population, or among countries (source).
- Lorentz curve
- In economics, the Lorenz curve is a graphical representation of the cumulative distribution function of the empirical probability distribution of wealth or income. The curve is a graph showing the proportion of overall income or wealth assumed by the bottom x% of the people (source).
Overview
As I began researching income inequality, I quickly discovered that the most commonly used metric for income inequality is called the Gini coefficient, which was developed in 1912 by the Italian economist Corrado Gini (Figure 2). You can find tables and graphs of the Gini coefficient for various countries in a number of places (e.g. OECD).
I subscribe to an excellent economics blog by Jodi Beggs that gives an excellent description of the Gini coefficient. Since she gives an excellent detailed description, I will just give a quick description below and I will refer you to her blog if you want more details. She also has a good Youtube video on the subject, which I embed here.
My Quick Gini Coefficient Briefing
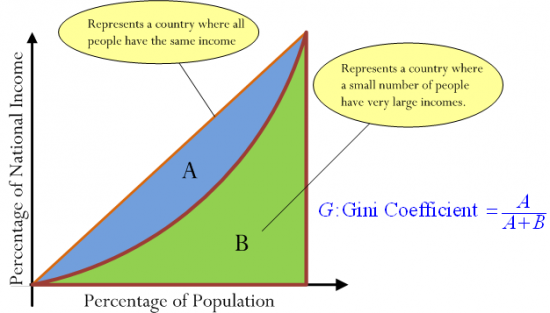
Suppose we examine the income of every individual of a country and arrange the individuals in order of increasing income. If we plot the percentage of national income versus the population percentage (Lorenz curve), we will get a curve like that shown in Figure 3.
The area of part B represents the total actual national income. Part A by itself represents the loss of national income because everyone does not earn income as the same as the wealthiest people. The areas of parts A and B together represents the national income that would be realized if everyone earned the same amount as the wealthiest person. The closer the country is to an equal income distribution, the smaller the Gini coefficient.
While the Gini coefficient is well-defined and its calculation is straight-forward, the definition of national income in not. Agencies use different measures of national income ? here are a few examples:
- pre-tax income
- post-tax income
- income without government transfer payments
- income with government transfer payments
The difference between pre- and post-tax results is particularly dramatic for high-tax countries. The Wikipedia actually lists both post- and pre-tax Gini coefficients from a number of agencies: World Bank, UN, and CIA.
Figure 4 presents a number of interesting special cases of the Gini coefficient. No country is perfectly egalitarian nor perfectly totalitarian. However, it is interesting to look at the Gini coefficients for places like Sweden (23%, close to egalitarian) and South Africa (63.1%, close to totalitarian). It does not surprise me that the Scandinavian countries all seem to be close to egalitarian. I live in Minnesota, which has strong connection with Scandinavian culture, and our politics has a strong egalitarian feel.
The Gini coefficient is not the only metric for income inequality. Here are a few other metrics that economists and politicians may use to educate or confuse us.
- Hoover Index (aka Robin Hood Index)
- Theil Index
- Atkinson Index
There are many other income inequality indices.
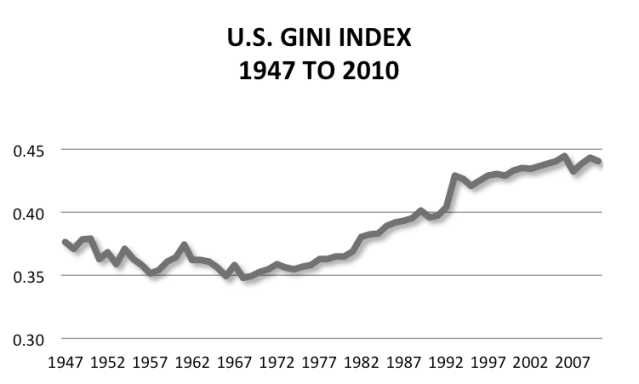
US Gini Coefficient over Time
Figure 5 shows how the Gini coefficient of the US has varied over time. We have definitely seen a significant rise over the last 40 years. This is most likely due to the introduction of technology and how easy it is for those already obtaining a portion of wealth to invest with forex apps uk among the likes of from any location with internet connection. Making money is no longer confined to office hours. Nowadays, money can be made from a number of different avenues, such as investments or even by playing some casino games. By using a live mobile casino, people can play different games in the hopes of winning some more money for themselves. This means that people can make more money from the comfort of their home.
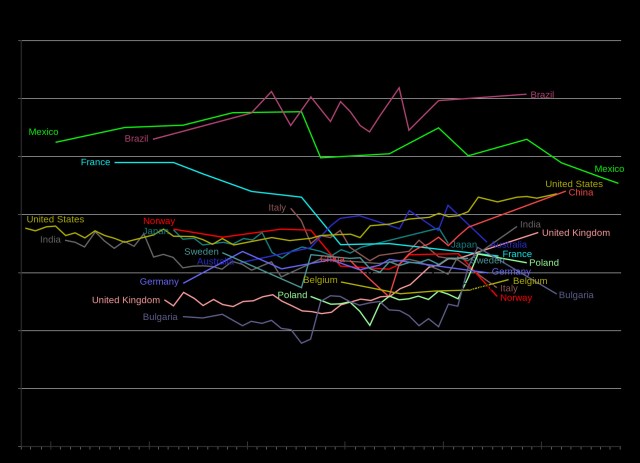
Figure 6 shows how the US Gini coefficient compares with other countries and how it has varied over time. Notice China's rise in income inequality. When I travel in China, I have heard concerns expressed by the people there about the rising income inequality.
Mathematical Definition of Gini Coefficient
The Wikipedia has an excellent discussion of how you can compute the Gini coefficient, but I am going to use a very simple approach with no simplifications.
| Eq. 1 |
where
- f(x) is the Lorentz curve for country of interest.
- x is the population percentage
Analysis
Economic Data
Figure 7 shows the Lorenz curves for the US in 1968 and 2010. I will digitize this graph using Dagra and evaluate the Gini coefficient using Mathcad.
Calculations
Figure 8 show how I computed the Gini coefficient. There are numerous simplifications that can be made when computing the Gini coefficient ? I used none of them.
My computed values have an error of about 1% from the reported Gini coefficients for 1968 and 2010 – not bad agreement considering the errors in digitizing off of an image.
Conclusions
I was able to understand how income inequality is defined, computed, and how it has changed for various countries over time. The US has clearly seen a rise in income inequality.


Just to mention I made an spreadsheet to calculate Gini coefficients of any data you might have.
I used it to calculate the Gini coefficient of tennis players, which ias bout 0.56, very unequal. My blog article about this (in french) is here : http://www.drgoulu.com/2013/10/26/112-le-prix-du-talent/
The sheet is freely available for non commercial uses in Excel here http://www.box.net/shared/njhn3h3out and in Google Docs here : https://docs.google.com/spreadsheet/ccc?key=0Al_D4zS2T4QodGNwZmF0YlNhTFJGMmlVMFloM1ZzZ2c&usp=sharing
I'm trying to promote the use of the Gini index in companies, where it is very easy calculate. How does your own company contribute to (in)equality ?
Note that the Gini index of the whole world decreases steadily since the '70s ( http://www.voxeu.org/article/parametric-estimations-world-distribution-income ) : the globalized world becomes more equal as (hundreds of) millions of inhabitants from the BRICS reach higher levels of income. Paradoxically, this leads to more inequality in theses countries as other (hundreds of) millions remain poor.
It is very interesting to compare the Gini index before and after faxes to see how money is redistributed . OECD has very nice graphs showing this for its member countries ( have them in french on http://www.drgoulu.com/2012/07/13/encore-plus-dinegalite/ ) . For example the Gini for the US shown in your post is the one before taxes. After taxes it is about 0.37.
In France, they have about the same Gini before taxes (0.44), but after taxes they're much more equal with Gini =0.29
In Switzerland (I'm swiss), we also reach a Gini after taxes of about 0.29, but it is "only" 0.34 before taxes : salary inequalities are low, so taxes do not need to redistribute much...
Hi!
I was wondering if you could help me out. How do you calculate the lorenz function for a give country? I canot find help from anywhere..
I have already understand the use od Gini coeficient and how to calculate it.