
Quote of the Day
Great things are not done by impulse, but by a series of small things brought together.
— Vincent van Gogh. Two of my three brothers that are football coaches. They regularly talk about breaking a complex athletic skill down into its component parts, master the skills associated with each component, then pull all the individual skills together. The same is true for all human skill building.
Introduction

I filter my news feed for anything related to astronomy, and I have been seeing a number of articles recently about large meteor explosions (called fireballs or bolides) in the atmosphere (example, example). These events are not occurring more frequently than before – we now have the technology to discover these explosions. The recent spate of bolide burst reports has caused me to become curious about how frequently these impacts are occurring. It turns out that NASA has an excellent set of web pages on this topic. There have been quite a few large meteor explosions, with the largest being the Chelyabinsk burst in 2013 (blog post on topic). As you can see in Figure 1, the cataloged meteor events are fairly even spread across the Earth.
My plan here is to do some analysis of the NASA meteor data using R and Rstudio. I am scheduled to provide some in-service R training within the next couple of months, and I am looking for some good examples. This post will summarize my histogram example.
While walking home from religious education one night in my youth, I saw a fireball that dropped fragments down over a nearby town (Appendix A shows a fireball similar to what I saw).
Background
Objective
I believe that R and Rstudio are the finest data analysis platform available today – I have tried a bunch – and they are free. In the past, I would analyze data using Mathcad or Excel, but today I use a combination of all three tools. While each of these tools has overlapping capabilities, they each also have distinct areas of strength.
In the case of R, the ggplot2 graphics package gives it superior graphics capability to both Excel and Mathcad. My focus will be on using R and Rstudio transform, analyze and present the NASA data.
Definitions
- Bolide
- A bolide is an extremely bright meteor, especially one that explodes in the atmosphere. In astronomy, it refers to a fireball approximately as bright as the full moon, and it is generally considered a synonym of a fireball (Source).
- Radiant Energy
- The total luminous energy released by the fireball.
- Impact Energy
- The estimated total kinetic energy in the meteor. The meteor dissipates its energy in the form of light and by working against the air. NASA has established an empirical relationship between the radiant energy and the impact energy.
- Equivalent Spherical Diameter
- Small asteroids are usually irregularly shaped because they are not massive enough for gravity to pull them into a spherical shape. However, NASA often presents a diameter that assumes the asteroid was spherical. This helps the public visualize the size of the asteroid.
Impact Energy Versus Radiant Energy
Equation 1 shows the relationship that NASA uses to relate the radiant energy to the impact energy (Source).
| Eq. 1 |  |
where
- E0 is the radiant energy of the meteor burst.
- E is the projected impact energy of the meteor if it had hit the ground.
Chelyabinsk Meteor Computation Example
Figure 2 shows my rework of NASA's Chelyabinsk mass estimate using Mathcad (Appendix B has a copy of NASA's work). I will be repeating this analysis for NASA's list of recent bolide's using R. I rounded my mass estimate to two significant digits – just like NASA did.
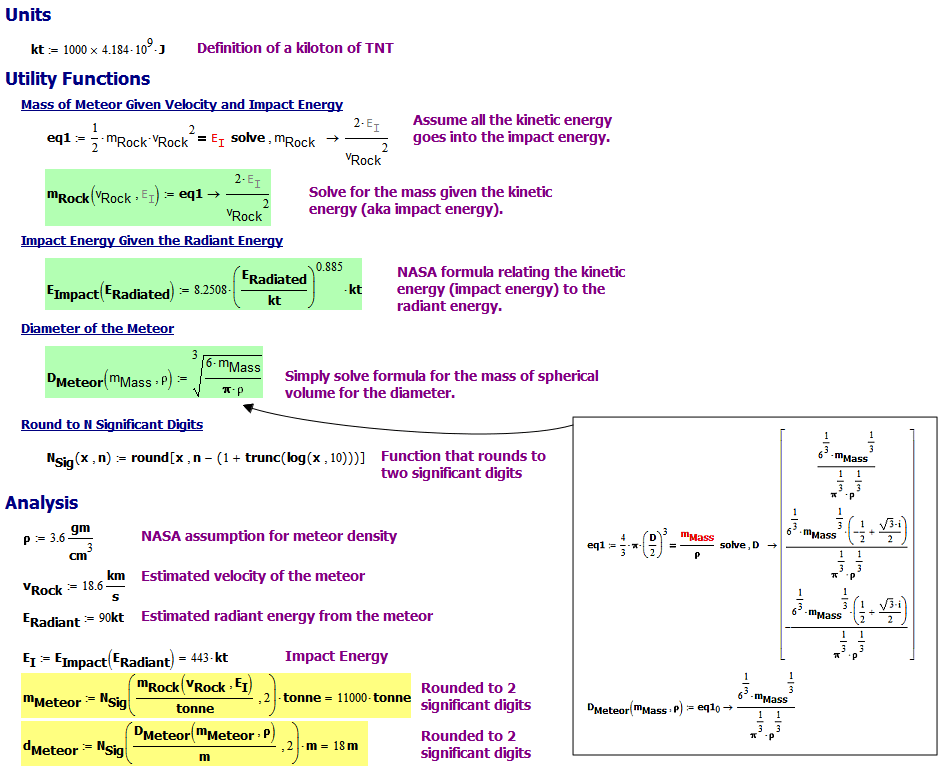
Figure 2: Mathcad Version of NASA Chelyabinsk Calculations.
I should comment that the Chelyabinsk meteor burst was unusually large. Quoting NASA,
This was an extraordinarily large fireball, the most energetic impact event recognized since the 1908 Tunguska blast in Russian Siberia.
The Tunguska meteor was in a different class than we have seen recently – it is estimated to have had a mass of ~500K tonne (tonne = metric ton = 1000 kg).
Analysis
Source Material
Data Cleanup/Transformation
The NASA data is available online here. I grabbed the data using Excel's web scraping tools. You can do similar things in R, but I find the Excel tools simple and quick – particularly with respect to web scraping.
Figure 3 is an excerpt of what I imported. The columns represent:
- alt = altitude, units: km
- vx = x-component of velocity, units: km/s
- vy = y-component of velocity, units: km/s
- vz = y-component of velocity, units: km/s
- ER = radiant energy, units: Joules

Figure 3: Display of Six-Items from NASA Data I Imported (Using Head Command in R) .
Data Augmentation
I need to augment my data with the following information:
- total velocity (name: v_T, units: km/s)
I computed the Euclidian norm of the three velocity components.
- impact energy (name: EIkt, units: kilotons)
Computed using Equation 1.
- equivalent spherical diameter (name: Dia, units: m)
Computed using the formula for the volume of a sphere and NASA's density assumption of 3.6 gm/cm3.
Figure 4 shows the top 25 meteors in terms of mass with my augmentations.

Figure 4: Top 25 Meteor Bursts Sorted By Meteor Mass.
Visualization
Altitude of Maximum Brightness Distribution
Figure 5 shows my plot of the altitudes at which the maximum meteor brightness occurred.

Figure 5: Distribution of Altitudes.
Velocity Distributions
Figure 6 shows the distribution of meteor velocities. Most of the meteors are in the 15 km/s range.

Figure 6: Meteor Velocity Distribution.
Mass Distribution
Figure 7 shows the mass distribution of the meteors. Notice how Chelyabinsk is an outlier.

Figure 7: Meteor Mass Distribution.
Diameter Distribution
Figure 8 shows the estimated diameters of the meteors. Again, notice how Chelyabinsk is an outlier.

Figure 8: Meteor Diameter Distribution.
Conclusion
Sorry for the long post. However, I think I have a good classroom example to use for demonstrating R and Rstudio to my coworkers.
Appendix A: Similar to Fireball I Saw in My Youth
Figure 9 shows a recent fireball that is similar to one I saw in my youth near Osseo MN.

Figure 9: This Fireball was Spotted Over the UK (Source).
Appendix B: NASA's Chelyabinsk Calculations
Here are some NASA calculations for the Chelyabinsk meteor that I used as my model (Figure 10).

Figure 10: NASA Chelyabinsk Calculations.
Pingback: Russian Meteor Characteristics | Math Encounters Blog