
Quote of the Day
The successful warrior is the average man with laser-like focus.
— Bruce Lee, martial artist, actor and filmmaker. I firmly believe that "average" people are capable of great things by focusing on what they are doing.
Introduction

Figure 1: Colpitts Oscillator Prototype.
It is the weekend and time to build my personal circuits. Some of my recent personal work has been focused on detecting cars in my cabin's driveway by using a loop of wire that experience an inductance change when a car passes over it. This weekend I built the Colpitts oscillator I discussed in this post, which is part of a car detector improvement I am considering. The circuit I am using now is not as sensitive as I would like, and I am hoping a few changes will allow me to detect smaller vehicles, like ATVs.
This new circuit is so simple that I expected it would work with no problems – the gods of electronics do not look kindly on this form of hubris. Of course, the oscillator would not oscillate. During my troubleshooting, I re-learned a couple of lessons that I thought would be worth sharing here. I have noticed that a number of other engineers have had startup problems with Colpitts oscillators and their issues were similar to mine.
The lessons I re-learned are simple and timeless:
- Inductors are not the same as their mathematical idealization.
In this case, I used a 100 µH inductor with 1.7 Ω of series resistance to simulate my loop of wire. My mathematical analysis and early simulations ignored the inductor's series resistance. It turns out that the gain required to make the circuit oscillate is strongly dependent on this series resistance. The lesson here is that I need to include the series resistance in future simulation efforts involving inductors.
- All component values are subject to tolerance variation.
I built my prototype (Figure 1) using some old 10% tolerance components I had laying around. It just so happened that their actual values all were in a direction that caused me to require more loop gain than I had predicted in my analysis using nominal component values. The lesson here is to make sure that I understand the sensitivity of my circuits to these component variations.
Ultimately, the problem was resolved by increasing the value of one resistor – the challenge was understanding why my simulation was off by so much. In the end, my simulation results matched the performance of my actual circuit. I now feel I can move forward since I have a firm grasp on the key performance-determining parameters.
For those who wish to experiment with my simulation, my LTSpice source is here.
Background
Previous Work
Please review my work in this post. It shows the initial circuit that I built assuming all nominal values. While the simulation worked fine, the actual circuit failed to oscillate.
Test Circuit
Figure 2 shows the actual circuit I built that worked with measured values. The key part modification required to ensure oscillation was changing R2, from 3 kΩ to 4.7 kΩ. The 3 kΩ value simply did not provide sufficient gain to make the real circuit oscillate. You will also see that I increased my capacitor values. This was not needed to ensure oscillation, but rather to reduce the oscillation frequency a bit.
This circuit and my simulation matched within reasonable expectations. While not shown in the circuit, the inductor has 1.7 Ω of series resistance in its model.

Figure 2: Colpitts Circuit I Built in the Lab.
Simulation Results
Figure 3 shows my simulation results. The simulation shows an oscillation frequency of 91.4 kHz.

Figure 3: Simulation Results for the Circuit of Figure 3.
Lab Results
Figure 4 shows the sinusoid present at Node 4 (Figure 2). The oscillation frequency is 94.3 kHz, which is relatively close (3% difference) to my simulation result of 91.4 kHz. The prototype waveform has a peak-to-peak amplitude of ~2 V, while the simulation had 2.3 V. This also is relatively close. These amplitude values are strongly determined by the limiting characteristics of the opamp, which are not well-modeled in the simulations.
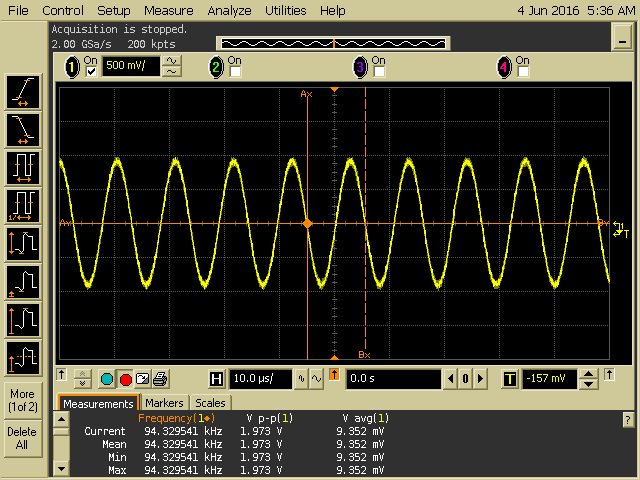
Figure 4: Opamp Output Voltage.
Figure 5 shows the output voltage of my opamp. As the simulation shows, this is a highly distorted signal. The way to stop this distortion is by controlling the waveform amplitude using a separate, more gentle nonlinearity. If I decide to pursue a less distorted output waveform, that would be a topic for a separate post.

Figure 5: Opamp Output Voltage.
Conclusion
I am quite happy with this circuit. It is part of a larger circuit for which I am designing a Printed Circuit Board (PCB). I expect to have this PCB ready for release in about 4 weeks. I will report on my test results when I get that PCB back, stuffed with parts, and tested.