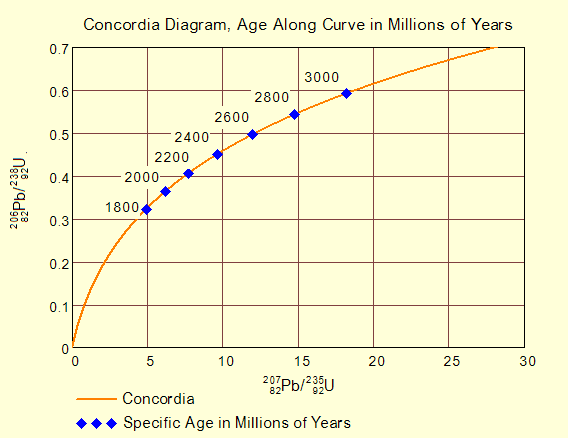
Figure 1: Concordia Plot Showing Uranium and Lead Ratios Versus Time.
Your email address will not be published. Required fields are marked *
Comment *
Name *
Email *
Website
Δ

