"If you have a talent, use it in every which way possible. Don't hoard it. Don't dole it out like a miser. Spend it lavishly like a millionaire intent on going broke."
Introduction
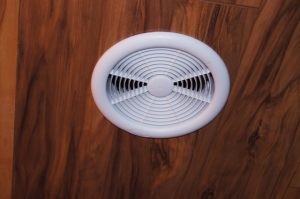
Figure 1: Grille of My New Bathroom Fan.
I recently began remodeling a small bathroom on the second floor of my home. As you can imagine, talk of bathroom remodels leads to plumbing work, whether that means repairs or installing brand new fixtures. Having a professional plumber local to you (perhaps like this - makeitdrainplumbing.com/los-angeles-plumbing-services/) in your book of contacts is probably common sense so that you can get the people you need on the job right away. I have never been happy with the ventilation in that bathroom, particularly during showers when it seems more like a steam room than a bathroom. I was recommended by a friend for different ideas of where I could upgrade my HVAC system, for example with companies like JAK Services: AC Repair in Denton, however by that time I had already got a plan. Next time, I told them, I might have to give in and find help! But anyway, I decided to upgrade the ventilation fan in this room and I have been very happy with the improved performance. Figure 1 shows how the fan looks on my ceiling − yes, I am experimenting with a wood ceiling . In this post, I will go through my fan selection process and my ultimate choice.
Background
Definitions
- Static Pressure (Ps)
- Fan static pressure is simply the losses in the system downstream of the fan, including the system's exit loss to atmosphere. Static pressure is independent of the air velocity. It is usually measured by a pressure tap perpendicular to airflow. You can think of static pressure as the pressure that exists inside of a balloon.
- Velocity pressure (Pv)
- Velocity pressure is the pressure caused by air in motion – it is the pressure required to accelerate air from zero velocity to some velocity and is proportional to the kinetic energy of the air stream.. Velocity pressure cannot be measured directly, but can be calculated from the difference between the total pressure and static pressure. The velocity pressure is due entirely to the motion of the flow and depends upon the velocity and the density of the fluid.
- Total Pressure (Pt)
- Total pressure is the sum of the Static Pressure, Ps, and the Velocity Pressure, Pv, at a given cross section in a duct. A tube placed in a duct facing into the direction of the flow will measure the total pressure in the duct. If frictional losses are neglected, the mean total pressure at any cross section throughout the duct system is constant. You can measure total pressure using the apparatus shown in Figure 2. You can find more details on this device in the Wikipedia under pitot tube.

Figure 2: Pitot Tube Setup.
- Roof Jack
- A roof jack is a device used to seal vent pipe protrusions from the roofing surface. It is important in HVAC design because it presents a resistance to the air flow. Making sure the air is flowing as intended is important. This is something that should be regualrly checked by a professional if you are not sure about anything. With this in mind, you may wish to visit a website like summersphc.com/anderson/services/cooling/ac-tune-up/ for more guidance.
- Wall Cap
- A wall cap is a device used to seal vent protrusions from a wall surface. It is important in HVAC design because it presents a resistance to the air flow. Another important decision to make is what kind of dosing pots are required before fitting the HVAC system.
Room Ventilation Basics
Requirements
The Home Ventilation Institute (HVI) recommends:
For bathrooms up to 100 square feet in area, HVI recommends that an exhaust fan provide 1 CFM [Cubic Feet Per Minute] per square foot (approximately eight air changes per hour) to properly ventilate the bathroom.
We can explain the "approximately air changes per hour" using the derivation shown in Figure 3. This derivation shows that the exact number of air changes per hour is 7.5, which everyone rounds up to 8.

Figure 3: Derivation of the Fan Rule of Thumb.
My Bathroom
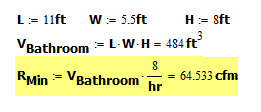
My bathroom is 11 feet long, 5.5 feet wide, and 8 feet tall. Using the 8 air-change per hour rule of thumb, we can compute the minimum ventilation rate required as shown in Figure 4.

Figure 4: Minimum Required Ventilation in Cubic Feet Per Minute.
Good Web Information Sources
There are numerous sources of good HVAC information on the web. I used the following pages.
Analysis
My analysis will follow the model used in this Stack Exchange response, which I found to be clear and to the point. For the purposes of my analysis, let's assume that my system will provide 90 CFM of air flow. I will then verify this assumption. If this assumptions is not correct, I will need to assume a difference air flow value and do the calculations again.
Equivalent Duct Length
The fan flow is a function of the path resistance to the air flow. All components in the system will be modeled as straight-duct length equivalences. The straight-duct length equivalences can be found in Appendix B. My system is pretty simple:
- 4-inch diameter aluminum ducts.
This is the diameter of PB110 inlet and outlet ports.
- 15 feet of straight length.
All resistances will be expressed in terms of equivalent straight-duct lengths.
- one 90 elbow.
The air resistance presented by a 90 elbow is often represented by 15 feet of straight duct length. I have seen other values used, but this is a common assumption.
- a roof jack
The air resistance of a roof jack is often modeled as equivalent to 30 feet of straight-duct.
For my bathroom ventilation system, the equivalent straight-duct length is 60 ft = 15 ft (straight run) + 30 ft (roof jack) + 15 ft (elbow).
We can use the chart in Appendix A to determine that 100-foot of 4-inch diameter duct carrying 90 CFM of air experiences a pressure drop of 0.58 inches of H20. This means that my 60-foot system will experience a pressure drop of 0.35 inches of H20 (=60 ft/100 ft 0.58 inches of H2O).
Candidate Fans
I have installed about fifteen ventilation fans over the years − primarily Nutone, Broan, and Fantech. Some of the units have integrated fan/grill assemblies and others have separate fan and grille assemblies. While the units with separate fans and grille are more expensive and more difficult to install, I have a preference for them because they are quieter when properly installed.
After looking at a large number of units, I have decided to the Fantech PB110 was the most appropriate unit for my bathroom. Figure 5 shows the unit.

Figure 5: Fantech PB110 Bathroom Fan.
The PB110 is specified to move 110 CFM of air with a static pressure of 0.25 inches of H2O. My air system will have somewhat more static pressure, so the air flow will be slightly lower. I will determine the actual air flow below.
Fan Flow Estimate
Figure 6 shows my ventilation systems flow rate for the static pressure that I am assuming. I started my analysis assuming a 90 CFM flow rate and my graphical analysis shows 92.5 CFM. This is close enough for this kind of HVAC work. I doubt I can read the chart in Appendix A to better than a 5 CFM precision.

Figure 6 : Fantech Graph Showing Air Flow For My Static Pressure.
Conclusion
I was able to design a ventilation system with a flow rate of ~90 CFM. I have built this system, but I do not have any tools that allow me to measure the exact fan flow rate. However, the fan air flow rate is clearly much higher than my old fan and it has eliminated the "steamy" bathroom problem that I have had.
I am very happy with my fan choice. It was a bit of a chore to install it because I had to mount the fan unit in my attic, which is heavily insulated and rather cold this time of year. However, the performance is superb and I finally have resolved my ventilation problem.
These calculations are similar to the calculations that I recently did on a dryer ventilation system. I will document those calculations in a post to follow.
Appendix A: Pressure Loss for Smooth Ducts
Figure 7 shows a chart of pressure loss per 100 feet of duct for various air flow rates (CFM) and duct diameters (Source). This chart may seem mysterious, but it simply a plot of the Darcy-Weisbach formula, which I work through here.

Figure 7: Pressure Loss in inches of Water Per 100 feet of Duct.
Appendix B: Straight Duct Equivalences of HVAC Items.
Figure 8 shows a list of common HVAC duct equivalences (Source).

Figure 8: Table of Duct Length Equivalences.


 is the
 . I just let Mathcad handle my unit conversions.