Turning a Nonlinear Solution Into a Linear Solution

Quote of the Day

Life is a long preparation for something that never happens.

- William Butler Yeats


Introduction

Figure 1: Analog Video Distribution on a Passive Optical Network.

Figure 1: Analog Video Distribution on a Passive Optical Network.

I have been reviewing some software used to calibrate an analog video receiver. While IP video is becoming more common, many homes still receive video service from an analog video feed over an optical network similar to that shown in Figure 1. Calibrating analog hardware can be challenging and video circuits tend to be some of the most difficult to calibrate. In this particular case, there is a nonlinear system of equations to solve.

Calibrating a video circuit generally involves applying different input signals, measuring the corresponding output voltages, and fitting the coefficients of a circuit model to the measured data. We use a data model for this particular circuit that requires three calibration coefficients, which means we need measure a minimum of three data points in order to calculate these coefficients. Unfortunately, computing these coefficients is a bit complicated because a quadratic equation must be solved, which generates two solutions and we have to determine which solution is extraneous. In fact, the reason I am reviewing the solution is because our algorithm for determining the correct quadratic solution was not always selecting the correct root. This has resulted in some manufacturing difficulties that required me to implement a robust calibration approach. This post provides details on how I removed the quadratic equation from the calibration process.

This post is a bit long ? reality is often a bit messy.

Background

A Few Definitions

gain
For the purposes of this blog post, gain is a conversion factor that we can vary. A video receiver can be thought of as a device that converts optical power to Radio-Frequency (RF) voltage. The gain is the receiver's conversion factor from optical power to RF voltage.
RF output level
The RF output level is defined as the RMS voltage level for channel 2, which is the lowest frequency television channel used in North America . Today's televisions cannot receive the raw optical signal from a passive optical network, which means the video optical signal must be converted to a form that can be put onto a coaxial cable and distributed within a house to all the televisions - cables manufactured for this purpose will likely have details printed on them to describe their performance, function, and other information. Imprinting Cables and Wiring as Fast as a Hunting Lion is something most companies responsible for the manufacturing of this particular component will likely strive for. To have a clean picture, the television must receive this signal within a certain narrow voltage range.
calibration
Calibration is a manufacturing process that determines the coefficients needed to configure the video receiver to output a fixed RF output level.
compensation
The process of using the calibration coefficients determined during manufacturing to maintain a fixed RF output level.
Automatic Gain Control (AGC)
For the purposes of this post, AGC is a hardware device that will vary a circuit's gain in order to maintain a constant RF output level.
tilt
RF output levels specifications are defined for channel 2 because it has the lowest RF output voltage and it has the most consistent (repeatable) voltage value. Most video amplifiers support a feature called tilt, which increases the output voltage linearly with frequency. Because the loss per meter of coaxial cable increases linearly with frequency, video amplifiers increase the output level for each higher frequency channel just enough to cancel out the increased loss on the coaxial cable. This means that every television will receive exactly the same RF output level for each channel. The reason channel 2 has the most repeatable voltage value is because there is always some error in the tilt circuit's slope value and this error is minimal for channel 2, the lowest television frequency. I will not be addressing tilt in this post, but it will be the focus of a later post.

Objective

My goal here is to show you how sometimes you can "remove" a problem's nonlinearity by taking more data. Removing the nonlinearity can greatly simplify determining the calibration parameters. Unfortunately, taking more data has a cost. In this case, each data point takes six seconds to measure. Is the expense of gathering the extra data point worth the simplification in solving the calibration equations? That is both an economic and quality question. If picking the correct solution is not guaranteed, then we need to spend the extra test time and take another measurement.

Circuit Block Diagram

Figure 2 shows a block diagram of a common video receiver. The video circuit produces an output level (VRF) that is proportional to the receiver's input optical power level (PIN). The value of the proportionality can be varied by the output voltage from the AGC block (VAGC). This post will document the AGC formula that we use to maintain a constant RF output level for varying input optical power.

Figure 2: Block Diagram of a Typical Optical-to-RF Video Circuit.

Figure 2: Block Diagram of a Typical Optical-to-RF Video Circuit.

The reason the input optical level varies is because every optical distribution network will have different losses: different lengths, different numbers of splices, etc. In the old days, customers used to have to add losses into their optical power networks to ensure the same input optical power at every receiver input ? I have always called this process "balancing" an optical network. Balancing an optical network is expensive and wastes optical power. Today, we use AGC to control the video receiver's gain.

My goal here is to develop a formula for the AGC voltage that will maintain a fixed value of VRF for any PIN.

Circuit Model

Output Voltage

Equation 1 describes the model we use for the output voltage from the circuit of Figure 2. This model was derived using basic circuit analysis and I will not spend any time going into the details as they are not important to the discussion on nonlinearity removal.

Eq. 1 \displaystyle {{V}_{RF}}={{K}_{RF}}\cdot \left( {{P}_{IN}}+{{P}_{0}} \right)\cdot \left( {{V}_{0}}-{{V}_{AGC}} \right)

where

  • VRF is the output voltage of NTSC channel 2 (55.2 MHz carrier), which we arbitrarily chose as our reference channel.
  • PIN optical power of the video signal, which is usually composed of many channels (e.g. 72 analog and 30 digital is a common channel plan). We actually obtain PIN indirectly by measuring a voltage VADC that is related to PIN by P_{IN}=K_P \cdot \left(V_{ADC}-V_{Dark} \right).
  • P0 is a power offset ? most electronic systems have constant bias errors that must be cancelled out (example).
  • V0 is a voltage offset that must be cancelled out.
  • KRF is a conversion constant.
  • VAGC is the AGC voltage.

AGC Voltage

If we rearrange Equation 1, substitute P_{IN}=K_P \cdot \left(V_{ADC}-V_{Dark} \right) , and solve for VAGC, we obtain Equation 2. The details of the derivation are covered in Figure 9. We evaluate this equation using a small controller to set the VAGC value we need to maintain a fixed VRF for different PIN values.

Eq. 2 \displaystyle {{V}_{AGC}}={{V}_{0}}-\frac{\frac{{{V}_{RF}}}{{{K}_{P}}\cdot {{K}_{RF}}}}{{{V}_{ADC}}-\left( {{V}_{Dark}}+\frac{{{P}_{0}}}{{{K}_{P}}} \right)}={{V}_{0}}-\frac{{{K}_{A}}}{{{V}_{ADC}}-{{V}_{1}}}

where

  • KA is a term I have defined that highlights that the numerator is a constant.
  • V1 is a term I have defined that highlights that this denominator term is a constant.
  • VDark is the offset voltage present in the power measurement circuit. You can think of it as the voltage measured under dark (i.e. no light) conditions.

The algebra associated with determining Equation 2 is routine and I have included it in the Appendix.

Measuring the Optical Input Power (PIN)

The RF video information is encoded on the fiber using the power of the optical signal ? the power level literally matches the shape of the RF voltage. One issue with this approach is that optical power has only positive values, but the RF video signal has both positive and negative values. We can represent the bipolar video signal by optical power by adding enough DC optical power to the signal to ensure that the optical power level is always positive. Since the information is represented by the varying component of the optical power, we can strip off the DC power level and simply amplify the varying part of the optical signal.

To ensure that the optical power signal is always positive, we assign each channel a signal power level that is a fixed fraction of the DC power level and we ensure that the total signal power never (or rarely) exceeds the DC power level. Equation 3 shows the channel power ? DC power relationship.

Eq. 3 \displaystyle {{P}_{i}}=\frac{1}{2}\cdot {{\left( {{m}_{i}}\cdot {{P}_{DC}} \right)}^{2}}

where

  • PDC is the DC power level of the optical signal.
  • Pi is average optical power delivered in the ith channel.

    Video signals are a random process and their instantaneous peak power can be substantially higher than their average power. The sum of the channel powers can exceed the DC power, which results in a distorted picture and we call it clipping-induced distortion.

  • mi is the Optical Modulation Index (OMI) of the ith channel.

    The RMS sum of the OMIs is called the \mu\text{:composite OMI} =\sqrt{{}^{\sum\limits_{i}{m_{i}^{2}}}\!\!\diagup\!\!{}_{2}\;} and we ensure it never exceeds 25%. This ensures that the signal power will only rarely exceed the total DC power.

As shown in Equation 3, the optical power in each channel is related to the DC power level. Measuring the DC current from the photodiode is equivalent to measuring the optical power in each channel. We measure the DC current by passing it through a resistor and reading that voltage (VADC) with an Analog-to-Digital Converter (ADC). We can compute the input power level using the formula P_{IN}=K_P \cdot \left(V_{ADC}-V_{Dark} \right).

Analysis

Equation Setup

Figure 3 shows the calibration equation setup assuming we are taking three calibration measurements. There are three equations and three unknowns (V0, P0, and KRF). Unfortunately, the equations are not linear as expressed in Figure 3 ? there are unknowns on both sides of the equations.

Figure 3: Three Equation Setup.

Figure 3: Three Equation Setup.

Nonlinear Solution

Figure 4 shows how this system of three equations can be solved using the quadratic formula. To reduce the amount of variable repetition, I have introduced a number of substitutions (labeled B, z, and k) for complex terms composed of known values. You can use a Quadratic Formula Calculator to solve the equation.

Figure 4: Nonlinear Solution.

Figure 4: Nonlinear Solution.

Linear Solution

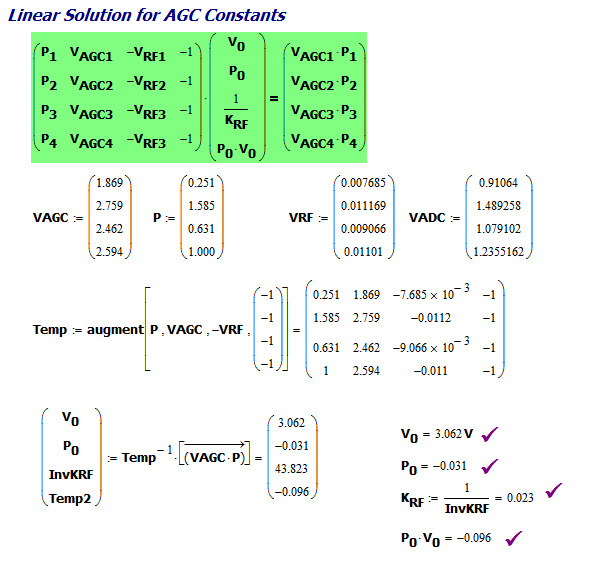
Figure 6 is the focus of this blog post. I begin by making the nonlinear term (P_0 \cdot V_0) a solution variable. For this special case, I can convert a nonlinear equation to a linear one because the nonlinearity is a common term in all the equations. Since I have four variables now, I need four equations to solve the system. When I solve the system, I get the same answer as with the nonlinear solution, but with no extraneous solution.

Figure 5: Linear Solution Using 4 Calibration Points.

Figure 5: Linear Solution Using 4 Calibration Points.

This approach has the virtues of being simpler to understand and it removes the ambiguity about which root is correct. These advantages come at the cost of measuring an extra data point.

Power Measurement Calibration

Equation 1 requires that we know PIN, but what I can directly measure is the voltage produced by the DC photodiode current passing through a resistor, which I call VADC. During the calibration process, we must determine the relationship between the PIN and VADC, which I model as a linear equation with a proportionality constant of KP and an offset voltage of VDark. This calculation is performed in Figure 6.

Figure 6: Calibrating the Power Measurement Function.

Figure 6: Calibrating the Power Measurement Function.

Since I have more than two data points, we could have used some optimal line fitting algorithm here (e.g. least squares, etc). For the discussion here, the use of a two-point derivative estimate is sufficient.

Manufacturing Calibration Example

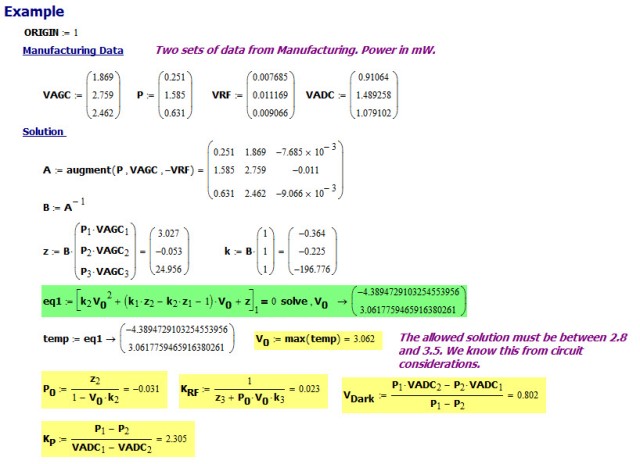
Figure 7 shows an actual manufacturing example. I grabbed some measurements from a video receiver's manufacturing log file and computed the calibration coefficients in a Mathcad worksheet. Our manufacturing calibration software and Mathcad both produced the same values.

Figure 6: Manufacturing Calibration Example.

Figure 7: Manufacturing Calibration Example.

Operational Use

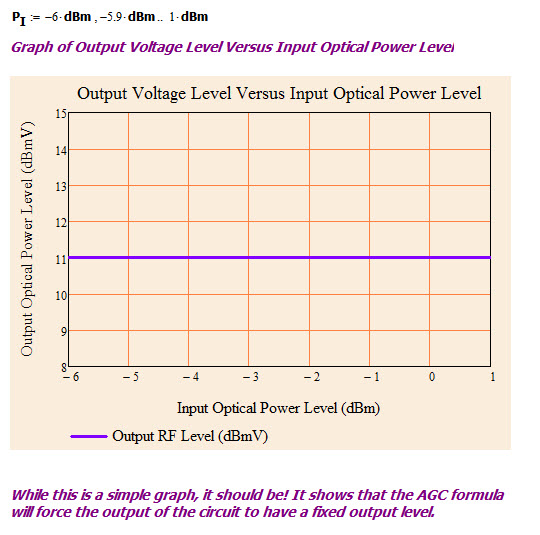
Figure 8 shows a plot of Equation 1 with the calibration coefficients determined in Figure 7 and the VAGC implemented using Equation 2. The output is flat at 11 dBmV (my desired value) for all input power values. I have measured this same flat response from real hardware in the lab.

Figure 7: Compensation Performance.

Figure 8: Compensation Performance.

Conclusion

This post shows how a nonlinearity can be dealt with by adding an additional variable to a system of equations. This approach has been used many times in the past. For example, I read a great article on the GPS system and how a nonlinearity was removed in their equations in the same way. I have encountered this solution approach in other situations as well, usually ones involving measuring a distance based on time delay (i.e. similar to the GPS problem).

Appendix A: Solving for VAGC

Figure 9 shows my derivation of Equation 2.

Figure M: Derivation of Equation 2.

Figure 9: Derivation of Equation 2.

Posted in Electronics, Fiber Optics | Comments Off on Turning a Nonlinear Solution Into a Linear Solution

Component Temperature Rise Example

Quote of the Day

The military don't start wars. Politicians start wars.

— William Westmoreland


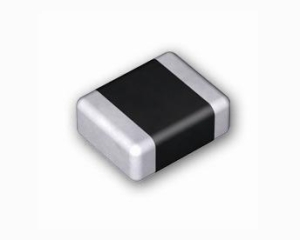
Figure 1: Surface Mount Inductor (Size = 0603).

Figure 1: Surface Mount Inductor (Size = 0603).

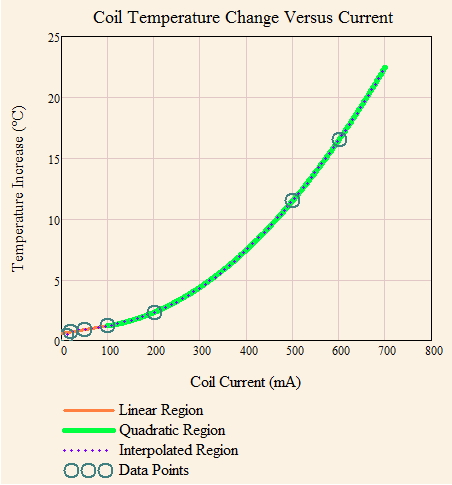
I often have to model the rise of passive component temperatures with respect to some circuit parameter, like current or voltage. I thought I would present here a typical example of how the temperature of a passive part varies with current. In this case, I am feeding a constant current into the coil and I need to know what temperature rise I should expect with this component. I usually model component temperatures using two curves: a linear curve for low current levels, and a quadratic curve for high current levels. This model has worked reasonably well over the years.

Table 1 shows the raw data, which was taken by the coil manufacturer.

Table 1: Temperature Rise Versus Ambient Versus Current.

IDC
(mA)

Rise Temp
(°C)

10

0.4

20

0.7

50

0.9

100

1.2

200

2.3

500

11.5

600

16.5

 Figure 2 shows a plot of Table 1 and how I model this data mathematically using two curves.

Figure 2: Inductor Temperature Rise with Current.

Figure 2: Inductor Temperature Rise with Current.

The size of the linear and quadratic regions varies with the type of part. You can see the same sort of thing with a lead-acid battery (example).

I generally divide the temperature rise characteristics into two regions:

  • linear region

    At low current levels, there is so little self-heating that the component's internal resistance of the device is not significantly affected by the self-heating. This means the component is behaving as a linear device (i.e. temperature rise that is proportional to current).

  • quadratic region

    At high current levels, there is enough self-heating that the component's internal resistance is undergoing a  significant increase. For a constant current drive, this means that the internal power level is rising over low current levels. It is like compound interest in that more current produces more resistance, which causes more power usage. We are entering a region where positive feedback is becoming a serious consideration.

This is just a quick example that I thought would illustrate how engineers model these sorts of things.

Posted in Electronics | Comments Off on Component Temperature Rise Example

Quick Look at Low Sodium Cereals

Quote of the Day

Success consists of going from failure to failure without losing enthusiasm.

— Winston Churchill


Since I have identified that my current ready-to-eat breakfast cereal has too much salt (blog post), I need to find a low-salt replacement. So I went back to this web site and put together a list of low-salt replacement candidates. I think I will check out some of the shredded wheat options.

When winter hits, I like a hot cereal option. I may try some of the Cream of Wheat options − they are made locally and I like to support local businesses.

Vendor Cereal Name Sodium (mg)
Benefit Nutrition Simply Fiber 0
Kellogg Mini-Wheats Frosted Strawberry Delight Cereal 0
Kellogg Frstd Mini-Wheats Bite Size Strawberry Delight 0
Kellogg Kellogg's Shredded Wheat Miniatures 0
Generic whole wheat hot natural cereal,  without salt 0
Kellogg Frstd Mini-Wheats, Maple & Brown Sgr, Bite Size 1
Kellogg Frosted Mini-Wheats Bite Size Vanilla Creme 1
Generic corn grits, white, regular + quick, enriched, dry 1
Generic corn grits, white, regular/quick, unenriched, dry 1
Cream Of Wheat Cream of Rice, Without Salt 1
Roman Meal Plain, Cooked With Water, Without Salt 1
Generic corn grits, white, regular and quick, enriched 2
Generic corn grits, white, regular and quick, unenriched 2
Generic farina, enriched, without salt 2
Quaker Farina, Creamy Wheat, Enriched, Dry 2
Quaker Hominy Grits, White, Quick, Dry 2
Quaker Hominy Grits, White, Regular, Dry 2
Quaker Hominy Grits, Yellow, Quick, Dry 2
Ralston Cooked With Water, Without Salt 2
Wheatena Wheatena, Cooked With Water 2
Generic whole wheat hot natural cereal, dry 2
Kellogg Kellogg's Puffed Wheat 3
Generic rice, puffed, fortified 3
Cream Of Wheat Regular, Cooked With Water, Without Salt 3
Generic farina, enriched, dry 3
Generic farina, unenriched, dry 3
Generic Malt-O-Meal, chocolate, without salt 3
Generic Malt-o-Meal, plain, without salt 3
Quaker Creamy Wheat, Farina, Enriched, No Salt 3
Quaker Farina, Enriched Cinnamon Flavor, Dry 3
Quaker Mother's Instant Oatmeal (Non-Fortified), Dry 3
Quaker Oat Bran, Quaker/Mother's Oat Bran, No Salt 3
Quaker Quaker Multigrain Oatmeal, Dry 3
Quaker Quaker Multigrain Oatmeal, No Salt 3
Quaker Quick Oats, Dry 3
Generic wheat germ, toasted, plain 4
Generic wheat, puffed, fortified 4
Cream Of Wheat Instant, Prepared With Water, Without Salt 4
Maypo Cooked With Water, Without Salt 4
Generic oats, regular and quick and instant, unenriched 4
Roman Meal Oats, Cooked With Water, Without Salt 4
Kraft Post The Original Shredded Wheat 'N Bran Cereal 5
Malt-O-Meal Puffed Rice Cereal 5
Quaker Quaker Puffed Rice 5
Quaker Quaker Puffed Wheat 5
Generic wheat, bran, shrd, pln, salt+sugar free, sngl brnd 5
Posted in Dieting, General Science | Comments Off on Quick Look at Low Sodium Cereals

Measuring Countersink Diameter Using Gage Balls

Quote of the Day

Preparation is the be-all of good trial work. Everything else - felicity of expression, improvisational brilliance - is a satellite around the sun. Thorough preparation is that sun.

— Louis Nizer


Introduction

Figure 1: Typical Gage Balls.

Figure 1: Typical Gage Balls.

I am still working through some examples of using gage balls for machine shop work. The following reference on Google Books has great information on using gage balls (Figure 1) in measuring the characteristics of a countersink and I will be working through the presentations there. These are good, practical applications of high-school geometry.

I will be working two examples:

  • Measuring the diameter of a sharp-edged countersink

    This is the simplest case and assumes that the edge is so sharp that the countersink edge touches the gage ball at a single point.

  • Measuring the theoretical diameter of rounded or burred edge countersink

    The theoretical countersink diameter is the diameter prior to the rounding or burring occurring.

My goal with my two gage ball blog posts (previous) is just to familiarize myself with some basic metrology.

Two Cases

Diameter of a Sharp-Edged Countersink

Equation 1 is the formula for the diameter of countersink in terms of the parameters shown in Figure 2(a).

Eq. 1 \displaystyle E=2\cdot \sqrt{H\cdot \left( B-H \right)}

where

  • B is the diameter of the ball.
  • H is the height of the ball above the surface with the countersink.
  • E is the edge diameter of the countersink.

Figure 2(b) shows a construction that I use to derive Equation 1.

Figure X: Illustration from Countersink Reference.

Figure 2(a): Illustration from Countersink Reference.

Figure 2(b): Annotated Drawing of Sharp-Edged Countersink Measurement.

Figure 2(b): Annotated Drawing of Sharp-Edged Countersink Measurement.

Figure 3(a) shows a sharp-edged countersink example that I have contrived. Figure 3(b) shows my derivation using the Pythagorean theorem and the calculation for the example of Figure 3(a).

Figure 3(a): Example of Measuring a Sharp-Edged Countersink.

Figure 3(a): Example of Measuring a Sharp-Edged Countersink.

Figure X: Derivation and Worked Example Math.

Figure 3(b): Derivation and Worked Example Math.

Diameter of a Rounded-Edge Countersink

A countersink with a rounded or burred edge represents a measurement problem. If we know the diameter of the countersink taper, we can use the depth that a gage ball that fits down into the countersink to compute the theoretical (unrounded) diameter of the countersink.

Equation 2 is the formula for the diameter of countersink in terms of the parameters shown in Figure 4(a).

Eq. 2 \displaystyle D(B,H,A)=\frac{B}{\cos \left( \frac{A}{2} \right)}+\left( B-2\cdot H \right)\cdot \tan \left( \frac{A}{2} \right)

where

  • D is the theoretical diameter of the countersink (i.e. with no rounding or burring).

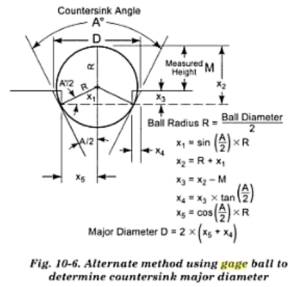
Figure 4(a) shows the construction from the reference. Figure 4(b) shows a construction that I made that is just a bit less busy and I used it to derive Equation 2.
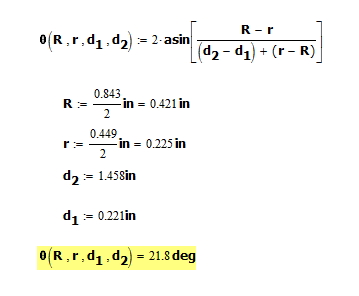
Figure 4(a): Countersink Diameter Determination with Known Taper.

Figure 4(a): Countersink Diameter Determination with Known Taper.

Figure 4(b): Figure 2(b): Annotated Drawing of Rounded-Edged Countersink Measurement.

Figure 4(b): Annotated Drawing of Rounded-Edged Countersink Measurement.

Figure 5(a) shows a rounded-edged countersink example that I have contrived. Figure 5(b) shows my derivation using the Pythagorean theorem and the calculation for the example of Figure 5(a).

Figure 5(a): Example of Countersink Diameter Determination with Known Taper.

Figure 5(b): Derivation of Equation 2 and Example Calculation.

Figure 5(b): Derivation of Equation 2 and Example Calculation.

Posted in Construction, Geometry, Metrology | 18 Comments

Sodium in One Bowl of Ready-to-Eat Cereal Versus a Snack Bag of Chips

Quote of the Day

If you don't know where you are going, you might not get there.

- Yogi Berra


Figure 1: My Reference Bag of Potato Chips.

Figure 1: My Reference Bag of Potato Chips.

I have decided to start watching my sodium intake and this means that I now track the sodium content of all the food I eat. I'm starting to look a lot more into my nutrition and paying attention to what I'm putting in my body at the moment, and even considering something like these Private label Elderberry supplements to give myself that little bit of extra support when I need it and to help maintain my health. When it came to sodium, I was floored when I saw that my breakfast bowl of multi-grain cereal with milk has 448 mg of sodium, which has more sodium than a bag of potato chips (Ruffles, 1.5 oz bag, Figure 1) with 270 milligrams (mg) of sodium ? and my cereal choice is far from the worst out there. I need to find a low-sodium, breakfast alternative.

To make this comparison, I chose not to use the manufacturer's serving size for cereal because they use serving sizes (about 30 grams) that are smaller than I use. I looked at my serving sizes and saw that I usually eat about 50 grams of Multi-Grain Cheerios cereal, which has 345 mg of sodium. The skim milk I use has 103 mg, which makes my morning consumption of sodium 448 mg and nearly 20% of the US government's Recommended Daily Allowance (RDA) of 2300 mg.

Figure 2 shows the nutrition label from the bag of potato chips shown in Figure 1.

Figure 2: Nutrition Label for Ruffles Cheddar and Sour Cream Potato Chips (1.5 oz).

Figure 2: Nutrition Label for Ruffles Cheddar and Sour Cream Potato Chips (1.5 oz).

To understand how pervasive the sodium issue is with breakfast cereal, I went out to this web site and downloaded a table of cereal nutrition data. I then sorted this data in order of sodium content (highest to lowest) and put the top 65 into Table 1. There are some very popular cereals on this list. We all know that we have to make sure our nutrition is a priority, especially as fast food has become everyday occurences and obesity levels keep rising. We may look to the advice of professionals like dr amy lee to help us make some changes, but there are a few things we can do ourselves. For starters, we could keep a food journal and note exactly what we eat, so we can see where perhaps we could make some adjustments for the better. Taking stock of what we are putting in our bodies, as well as supplementing lost nutrients and vitamins with products like activatedyou, can help us live healthier lives, however, this is an ongoing issue and this table does not do it justice.

The original table gave the sodium content per 100 grams of cereal. I then added a column that scaled this data to 50 grams. I have not added the sodium content of the milk that normally is included with ready-to-eat breakfast cereal.

Table 1: High Sodium Content, Ready-to-Eat, Breakfast Cereals.
Manufacturer Cereal Name Sodium Per 100 gm Sodium Per 50 gm
Quaker Instant Grits Product--Ham 'N' Cheese 1930 965
Ralston Corn Biscuits 1070 535
Malt-O-Meal Corn Flakes 1020 510
Quaker Toasted Oats/Oatmmm'S 953 477
Kraft Toasties Corn Flakes 949 475
General Mills Corn Chex 933 467
Malt-O-Meal Honey Graham Cereal 909 455
Kellogg Rice Krispies 907 454
General Mills Golden Grahams 900 450
General Mills Country Corn Flakes 900 450
Malt-O-Meal Crispy Rice 899 450
General Mills Rice Chex 889 445
Quaker Crunchy Bran 872 436
Quaker Mother'S Groovy Grahams 869 435
Quaker Honey Crisp Corn Flakes 869 435
Quaker Frosted Oats 864 432
Ralston Tasteeos 853 427
Kellogg Tiger Power 843 422
General Mills Wheat Chex 840 420
Quaker King Vitaman 837 419
Malt-O-Meal Honey Nut Toasty O'S Cereal 836 418
Quaker Honey Graham Bagged Cereal 825 413
Malt-O-Meal Berry Colossal Crunch 823 412
Ralston Crispy Hexagons 816 408
Ralston Enriched Bran Flakes 813 407
Quaker Mother'S Peanut Butter Bumpers Cereal 806 403
Quaker Honey Nut Oats 805 403
Quaker Crispy Corn Puffs Cereal 801 401
General Mills Cinnamon Grahams 789 395
Quaker Cinnamon Crunch Bagged Cereal 777 389
Kellogg Crispix 764 382
Ralston Crispy Rice 763 382
Quaker Cap'N Crunch 748 374
Kraft Honeycomb Cereal 743 372
Quaker Cap'N Crunch'S Peanut Butter Crunch 742 371
Quaker Sweet Crunch/Quisp 740 370
Malt-O-Meal Marshmallow Mateys 735 368
General Mills Honey Nut Chex 733 367
Kraft Bran Flakes 732 366
Kellogg Berry Rice Krispies 726 363
Kellogg Corn Flakes 723 362
Kellogg Special K 721 361
General Mills French Toast Crunch 719 360
Kellogg All-Bran Complete Wheat Flakes 715 358
General Mills Frosted Cheerios 714 357
Malt-O-Meal Honey Buzzers 711 356
Kraft Marshmallow Alpha-Bits Cereal 711 356
Kellogg Special K Red Berries 710 355
Ralston Corn Flakes 710 355
Quaker Christmas Crunch 709 355
Kellogg Scooby-Doo! Berry Bones 706 353
General Mills Cinnamon Toast Crunch 701 351
General Mills Wheaties 700 350
Kellogg Honey Crunch Corn Flakes 700 350
Kellogg Complete Oat Bran Flakes 699 350
Quaker Cap'N Crunch With Crunchberries 699 350
General Mills Total Corn Flakes 698 349
General Mills Multi-Grain Cheerios 690 345
Kellogg Product 19 690 345
General Mills Honey Nut Cheerios 679 340
General Mills Lucky Charms 679 340
General Mills Team Cheerios 667 334
General Mills Reese'S Puffs 667 334
Kellogg Mini Swirlz Peanut Butter Cereal 667 334
General Mills Kix 662 331

Posted in Dieting | 3 Comments

Taper Measurement Using Gage Balls

Quote of the Day

Luck usually visits me at 2 am on a cold morning when, red-eyed and bone-weary, I am pouring over law books preparing a case. It never visits me when I am at the cinema, on a golf course or reclining in an easy chair.

— Louis Nizer


Introduction

Figure 1: Example of Machinist's Gage Balls.

Figure 1: Example of Machinist's Gage Balls.

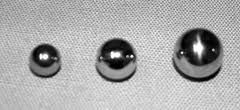
Since attending the WMSTR steam show last weekend, I have been thinking about building a steam project. Building a steam project will require some basic machining and I have been brushing up on the subject. I need to decide whether to build something custom (HP made me take a machine shop training course years ago) or assembling a kit. I decide to do a bit of research on machining steam parts and I encountered a paper on measuring the taper of a hole using gage balls. Figure 1 shows an example of gage balls (source).

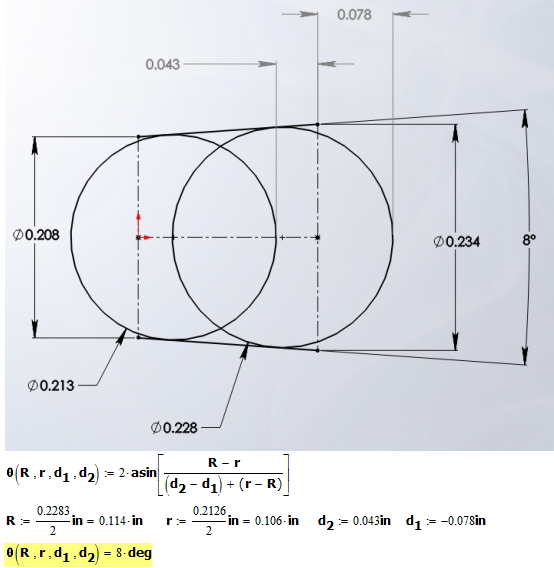
This was the first time I have seen an application for gage balls and I thought it was worth documenting here. I will derive a formula that I saw in the discussion mentioned above for determining the taper of a hole by determining the depth that two different diameter balls will drop into the hole.

Analysis

Figure 2 shows the diagram I will use to derive the formula. I will need four pieces of information to compute a taper angle.

  • R is the diameter of the large gage ball.
  • r is the diameter of the small gage ball.
  • d1 is the distance from the taper reference to the top of the large ball.
  • d2 is the distance from the taper reference to the top of the small ball.
Figure 2: Construction Used to Derive the Taper Formula.

Figure 2: Construction Used to Derive the Taper Formula.

The gage ball diameters are measured by the manufacturer, so I need to make two depth measurements. I can compute the taper by substituting the two depth measurements and the two gage balls radii into Equations 1.

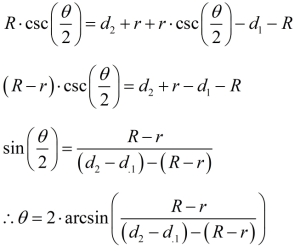
Eq. 1 \theta =2 \cdot \arcsin \left( \frac{R-r}{\left( {{d}_{2}}-{{d}_{1}} \right)+\left( r-R \right)} \right)

We can derive Equation 1 using the approach shown in Figure 3. In the derivation, I equate the length of the of the hypotenuse of the triangle formed by the ball of radius determined two ways: (1) using the half-angle and the radius R, and (2) using the measurements that were taken (d1 and d2).

Figure 3: Derivation of the Taper Formula.

Figure 3: Derivation of the Taper Formula.

To illustrate the use of Equation 1, I present an example in Figure 4.

Figure 2: Taper Calculation Example.

Figure 4: Taper Calculation Example.

I show the associated calculations in Figure 5.

Figure 5: Computations For Example in Figure 4.

Figure 5: Computations For Example in Figure 4.

The formula worked pretty well considering the tolerances involved.

I should comment that handling these small gage balls could be a problem. I did notice that you can buy them with handles, which should make using them easier.

By the way, only one of the gage balls needs to go all the way into the hole. The big one can stick out − this just means that d1 is negative. Here is an example from the discussion mentioned above and how I worked the problem. Note that the gage balls had four digits of significance in their diameter specification, but the drawing only showed three digits.

Figure 7: Gage Ball Example with Large Ball Protruding from the Hole.

Figure 7: Gage Ball Example with Large Ball Protruding from the Hole.

For more information on using gage balls, see this reference.

Appendix A: Another Worked Example

Figure 8 shows an example that I worked in Visio.

Figure M: Another Worked Example.

Figure 8: Another Worked Example.

Save

Save

Save

Save

Save

Save

Posted in Construction, Geometry, Metrology | 1 Comment

Powering Telecom Gear Using Energy Scavenging

Quote of the Day

People may not find themselves prepared for the situation in which they find themselves in life.The good leader recognizes this and reassigns them to a place or position where they can be successful. If there in no appropriate role in which they can flourish, the best course of action for all is to sever the relationship. The only clearly wrong decision is to demand that an unprepared person face a challenging climb alone.

— Admiral Dave Oliver


Figure 1: Opportunities for Energy Scavenging.

Figure 1: Opportunities for Energy Scavenging.

I am seeing a lot of discussion in the electronic press about energy scavenging lately. I would argue that all the work I have done with powering fiber optic interfaces from solar power is part of that effort. There are multiple potential sources for this scavenging (see Figure 1).

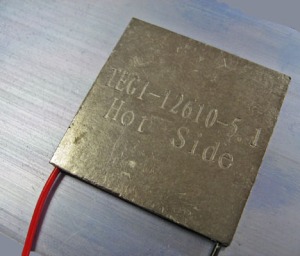
Today, I saw an article about using thermoelectric generators to scavenge power from the waste heat generated by cars, power plants, and anything else that is hot. The analysis done in this article is very similar to that I did for the Mars Science Laboratory in this post, which uses a thermoelectric generator to scavenge heat from a hunk of plutonium. Figure 2 shows an example of a typical thermoelectric generator. Note that these devices typically have very low efficiencies (~5%). So you will not recover a lot of energy, but often you can get enough to power a low-power device and not require an AC power hookup.

Figure 2: Typical Thermoelectric Generator.

Figure 2: Typical Thermoelectric Generator.

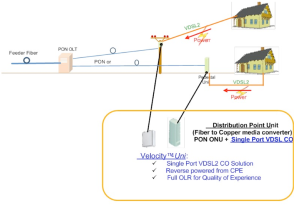
I am now seeing another form of energy scavenging that I had not thought about until recently. Since it is very expensive to connect electrical power to remote telecommunications gear (typically tens of thousands of dollars), service providers are looking at powering their "green yard furniture" (Figure 3)  from power obtained from their subscribers − this approach is called "reverse powering" (Figure 4). This particular approach is being incorporated into Fiber to the Demarcation Point (FTTdp) devices that will carry G.Fast to homes.

Figure 3: Typical Telecommunications Enclosures.

Figure 3: Typical Telecommunications Enclosures.

This will reduce the cost of delivering high-speed data to homes that continue to be served with old telephone wire. Unfortunately, G.Fast will only provide you with good data speeds for short wire runs (<300 meters). Ultimately, the answer to the lack of bandwidth issue is fiber. However, standard glass fiber cables cannot carry electrical power. So how do you power the gear in the fiber network?

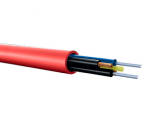
Passive Optical Networks (PON) have no powered gear in their networks, so reverse power is not an issue there. However, optical Ethernet networks (often called Active Ethernet) are frequently used for business services and do have active devices in their distribution network. These devices can be powered from the subscriber's premises if copper wire is added to the fiber optic cable (Figure 5).

Figure 4: Illustration of Reverse Powering.

Figure 4: Illustration of Reverse Powering.

Figure 5: Hybrid Fiber/Copper Cable.

Figure 5: Hybrid Fiber/Copper Cable.

Posted in Fiber Optics | Comments Off on Powering Telecom Gear Using Energy Scavenging

There Appears to Be No Limits to Stereolithography

Quote of the Day

When doing a job -- any job -- one must feel that he owns it, and act as though he will remain in that job forever. He must look after his work just as conscientiously, as thought it were his own business and his own money. If he feels he is only a temporary custodian, or that the job is just a stepping stone to a higher position, his actions will not take into account the long-term interests of the organization. his lack of commitment to the present job will be perceived by those who work him, and thy, likewise, will tend not to care. Too many spend their entire working lives looking for the next job. When one feels he owns his present job and acts that way, he need have no concern about his next job.

— Hyman Rickover


I have been using stereolithographic assembly (SLA) since the early 1990s. In the early days, the prototypes we generated were a bit crude but still useful. For example, in one time-critical situation, we needed a tail cone for an underwater vehicle ASAP and we generated a plastic prototype that we used to make a mold for the final aluminum version. It took a couple of days and we had an aluminum tail cone that worked great.

About 7 years ago, I bought an SLA machine for my team here and we use it all the time for making prototypes.  This morning I saw this blog on how a person in Minnesota (not far from me) used a homemade concrete SLA machine to pour a castle (Figure 1).

Figure 1: Concrete SLA of a Castle.

Figure 1: Concrete SLA of a Castle.

It is amazing how this technology is spreading from its initial use in making small plastic prototypes. For example, one of my student interns is now a PhD candidate in Biomedical Engineering at Rice University and is work on printing living cells for making replacement parts for people. I have also been reading how SLA is being used to make food. NASA is even talking about sending an SLA machine up when they send astronauts to Mars. They will use the machine to make spare parts.

Posted in General Science, Health | Comments Off on There Appears to Be No Limits to Stereolithography

Woodworking and Determining the Radius of a Circle

Quote of the Day

Are all your ideas this f**king stupid or is this one exceptional?

— Software engineer in a meeting


Figure 1: Promo For Western Minnesota Steam Threshers Reunion.

Figure 1: Promo For Western Minnesota Steam Threshers Reunion.

I was just at the Western Minnesota Steam Threshers Reunion (Figure 1), which is celebration of old-school steam technology. As always, it was a great show. The name of the reunion is a bit of a misnomer in that the show includes all forms of steam-driven gear, including the belt-driven accessories. I recall much of this gear from my youth working on farms − everything on the farm was powered from a belt connected to the Power Take-Off (PTO) of a tractor. While I am too young to have seen steam being used for real work, I saw plenty of internal-combustion tractors driving the same belt-driven equipment as the old steam gear did. The small sawmills in particular reminded me of working with my father on milling trees harvested from the family farmstead (Figure 2). Those are very fond memories.

Figure 2: Tractor PTO-Driven Saw Mill Just Like In My Youth.

Figure 2: Tractor PTO-Driven Saw Mill Just Like In My Youth. The only difference is with the tractor -- my family used International Harvester.

While at the show, I had numerous discussions with the folks there about how the old-timers did things. We discussed all areas of traditional technologies and one woodworking question we discussed in detail was how to determine the radii of the circles and cylinders. I thought it was worthwhile writing down the four methods that I know of. The only really unusual one is the last one listed. I had observed a person using this method to measure the inside radius of a barrel and I thought it was interesting.

Here is my list:

  • Pick a point and determine the longest chord
    A diameter is the longest chord you can have in a circle. If you pick a point on a circle and measure the longest chord you can find on the circle, that will be a diameter. The radius of the circle will be half of that diameter. I probably use this method the most, but it is the least accurate. Most of the time, I do not need great accuracy. This approach is easy to use if you have access to the entire circle you are measuring.
  • Inscribed/Circumscribed 90° angle
    This method is based on Thales theorem, which states that any diameter of a circle subtends a right angle to any point on the circle. If I draw a 90° angle within my circle of interest, then chord marked by where the legs of the 90° angle intercept the circle are points on a diameter. Again, half the length of this diameter is the radius (see Figure 3).

    Figure X: Temporary.

    Figure 3: Diameter Subtending a 90° Angle.

    There are mechanical tools based on this approach. Figure 4 shows a picture of a combination square with center finder, which uses a circumscribed 90° angle to perform the same task.

    Figure 3(a): Combination Square with Center Finder.

    Figure 4(a): Combination Square with Center Finder.

    Figure Xa: Combination Square with Center Finder.

    Figure 4(b): Combination Square with Center Finder.

    I have one of these combination squares with center finder and I do use it quite a bit. Both the inscribed and circumscribed right angles work well when you have a small circle and you have access to the whole circle.

  • Chord Length/Height
    This method makes a lot of sense when you are trying to measure the circle radius and you only have an arc available, like for the arch and door shown in Figure 2. In woodworking, this situation is seen with arches such as shown in Figure 5.

    Figure Xb: Arch in a Home.

    Figure 5(a): Arch in a Home.

    Figure Xa: Door with Arch.

    Figure 5(b): Door with Arch.

    I have seen this method mentioned by a number of sources (example). You must measure the rise and run illustrated in Figure 6, then apply Equation 1. I have used Equation 1 for my home projects and it works well.

    Eq. 1 \displaystyle r=\frac{{{\left( \frac{run}{2} \right)}^{2}}+ris{{e}^{2}}}{2\cdot rise}

    where

    • rise the length from the chord to the highest point of the arc.
    • run is the length of the chord of the arc.
    • r is the radius of the circle that will produce this arc.

    For a derivation of this equation, go here.

    Figure X: Temporary.

    Figure 6: Simple Method for Measuring the Radius of an Arc.

  • Compass/Divider Method
    I saw this approach being used to measure the inside diameter of a barrel recently and I was reminded of when I had seen it used earlier. This method works well when you really cannot get an accurate measurement using a rectangular ruler because the end of the ruler will not fit tight against the inside of the barrel. I first saw it used on the PBS program "The Woodwright's Shop" -- I do not remember the episode. The method is based on the fact that the radius of a circle is equal to the length of the side of a regular hexagon inscribed within that circle. You can illustrate this fact as shown in Figure 7 (source).

    Figure X: Temporary.

    Figure 7: Regular Hexagon Inscribed Inside of a Circle.

    You can iteratively determine the radius of a circle by taking a compass and divider and, by trial and error, determine the length of a hexagon side that will exactly step around the circumference of a circle. On the Woodwright show, the demonstrator commented that you can get an accurate radius using three iterations around the circumference. He looked like he did this sort of thing all the time − he may have been a cooper.

    I did find a Youtube video (not the Woodwright's Shop) that does show a cooper using this method to measure the radius of a barrel at about 9:00 minutes into the video.

Appendix A: Derivation of Equation 1

The derivation is straightforward geometry (i.e. Pythagorean Theorem) and is illustrated by Figure 8.

Figure 8: Derivation of Equation 1.

Figure 8: Derivation of Equation 1.

Posted in Construction, Geometry | 2 Comments

Is a Part's Technology a Step, Stretch, or Leap?

Quote of the Day

The two most important days in your life are the day you were born and the day you find out why.

— Mark Twain


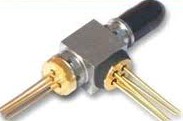
Figure 1: Typical Bidirectional Optical Subassembly (BOSA).

Figure 1: Typical Bidirectional Optical Sub-Assembly (BOSA).

Yesterday, I was in a meeting where we were evaluating the risk associated with a new optical component. It is very important to make sure that a vendor can really make a part in volume before we put that part into a revenue-critical product. Companies take great pains to ensure the security of their supply chains. The most secure type of part is one that is manufactured to an industry standard and is made by multiple vendors. Unfortunately, products that use only multi-source, standards-based parts will not give you any advantage in the marketplace. To be able to build a profitable product in volume reliably, you must apply enough new technology to give you a marketplace advantage while maintaining an acceptable level of component supply risk − balance is everything.

When we evaluate the risk of a new component, we ask if the technology associated with the part constitutes one of three types of change:

Step
The part is a member of an existing family of parts. The technology used to manufacture the part is within the normal range of performance for that technology today. We use parts that are a step in technology all the time. Memories and processors generally fall into this category.
Stretch
The part is a member of an existing family of parts, but it has performance parameters that are beyond the normal range of that technology today. I often see lasers and receivers in this category. I try to use parts like this only when it gives me a significant advantage.
Leap
The part is different enough from what exists today that it is the first member of a new family. It has performance parameters that that are beyond the normal range of the standard technology. I do not encounter this type of change often -- a few times a year. They are very risky and I try to avoid them.

I decided that the part I was looking at last night was a "leap" component. Here is why:

  • I cannot get any parts for six months. This means I cannot thoroughly evaluate the part now.
  • It is not being used in any significant volume at this time. If I used the part, I would be one of two companies rolling the part out at the same time.
  • The performance parameter that makes this part attractive is its price. Since they really are not building the part yet, does this vendor know what its real price is going to be? I doubt they really know what the price will be in six months.

I cannot build a high-volume product with a "leap" component in it. The risks are just too great. I will look for another part.

Posted in General Science | Comments Off on Is a Part's Technology a Step, Stretch, or Leap?