Hip Roof Angle Calculations

Quote of the Day

The only hope of a pure mathematician is to die before their work is applied.

- Pure mathematician stunned to hear that his work found an application in string theory.


I am considering building a small structure at my lake cabin that has a hip roof. Now a hip roof is pretty awesome, I'm considering consulting with someone like Mars Restoration to find out all the ins and outs and how I can build this structure in compliance with a roof like this. It's been on my mind for a while. When I bought the cabin, it was pretty run down and in need of a lot of repairs but because of other commitments, I had to hire a contractor and a roofer in Wilmington, DE to do most of the work for me. They did a good job but as you know, I'm a big fan of DIY so I'm wanting to build this structure myself.

Obviously, I don't have as much experience as the roofer I hired for my cabin so I've had to do a lot of research into this, looking into companies similar to 99Roofers to see what they offer. If I did do the roof myself there was a good chance that I would miss something important and later witness the roof coming down. The structure will look a little bit like the one shown in Figure 1 but with a steeper roof pitch. This roof has a 3/12 pitch whereas I'm looking for more of an 6/12 roof pitch.

Figure 1: Small Shed with Hip Roof.

Figure 1: Small Shed with Hip Roof.

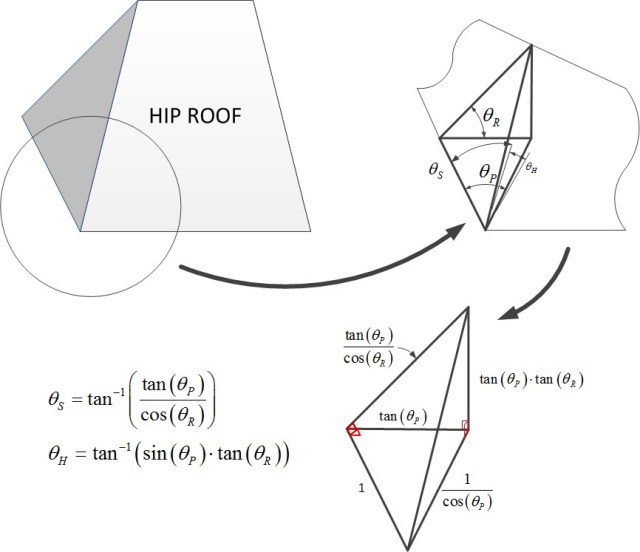
To build this structure, I need to compute a few angles and, unfortunately, I have forgotten how to determine them using a steel square. To derive formulas for the critical angles, we need to define some terms, which I do in Figure 2. Using these angle definitions, I will derive formulas for the sheathing (?S) and hip pitch angle (?H) given the common pitch angle (which I call the roof pitch [?R]) and plan angle (?P).

hip_roof_angles

Figure 2: Illustration of Hip Roof Angles.

Figure 3 shows my derivation. The derivation uses basic geometry, so I will just let the drawing stand for itself. If more detail is needed, send me a note. I will use this post to document formulas as I need them.

Derivation

Figure 3: Derivation of Hip Roof Angle Formulas.

I did find formulas for these angles presented on this web page, but no derivation was given ? that's no fun at all!

Posted in Construction | 6 Comments

Interesting Chart on US Health Care Costs

Quote of the Day

I don't know what I think until I write it down.

— Joan Didion


I have family members who are involved in the US health care system and we often talk about what is good and bad about our system. Once aspect of the our system that none of us understand is why it is so costly considering the level of service it provides. I have tried to become more informed on the subject by reading all I can, including the books by Atul Gawande ? which are excellent. However, the answer still eludes me.

Clearly, there are countries that have good medical care for less cost than in the US. One of the engineers in my group was on vacation recently in Sweden with his family. While in Sweden, his daughter fell off her bicycle and broke her arm. She was taken to a hospital in Stockholm where he said his daughter received excellent treatment. He said that followup visits in Estonia and Iceland were also done efficiently and professionally. I have also talked to an engineer in our group from France, who also mentioned the excellent medical care that he received when he lived there.

During my reading, I encountered Figure 1, which shows a chart of life expectancy versus per capita health care expenditures (source).

Figure 1: Longevity Versus Health Care Costs By Country.

Figure 1: Longevity Versus Health Care Costs By Country.

I am stunned at our mediocre longevity outcome for such exorbitant costs. Another aspect of this cost that I do not understand is how much more US health care costs are dominated by the expenses for the elderly than in other countries (see this post). Everyone spends more on treating the elderly than they do for young people, but not like the US. This is even despite insurance policies being taken out. Dental insurance is often recommended for seniors since their dental expenses usually increase with age. In order to save money they should get a discount plan as early as possible, but this doesn't seem to have much of an impact on the cost of their care for the state.

More research to follow …

Posted in Health | 4 Comments

Modeling Manufacturing Defect Level Versus Process Yield and Test Coverage

Quote of the Day

Innovation has nothing to do with how many R & D dollars you have. When Apple came up with the Mac, IBM was spending at least 100 times more on R & D. It's not about money. It's about the people you have, how you're led, and how much you get it.

— Steve Jobs


Introduction

Figure 1: Surface-Mount Assembly Line. These facilities are typically very clean to prevent contamination issues.

Figure 1: Typical Surface-Mount Assembly Line.
These facilities are typically very clean to prevent contamination issues.

Both manufacturers and their customers are very frustrated when customers receive products that fail "out of the box". I have recently worked on an "out of the box" failure issue that involved units that passed our acceptance tests at the factory but would fail in the field and I thought it might be useful to discuss how this happens and what manufacturers do to minimize the field failure rate (Figure 1 shows a modern electronic assembly facility [source]).

When products are released to production, we generally have a pretty good idea as to what our manufacturing yields and our defect level (aka out of the box failure rate) will be. We have mathematical models for how things fail in manufacturing and generally those models work well. However, all modeling involves making approximations and assumptions. My focus in this note is to show how a minor process problem that our tests could not detect caused some issues for our customers.

We work hard to ensure that our products have a very low defect level, but we cannot make our defect level zero because it is impossible to perform a test for every possible failure mode. All tests have the potential for "false negatives" -- your test fails to find a defect where one exists -- and false negatives are the primary source of "out of box" failures.

In the particular case, I am going to address here, how a process problem occurred that produced a defect in ~0.8% of the units that our manufacturing tests missed. This meant that our defect level rose to 0.8% for a while, yet our models said that we should have a defect level of 1 in 10,000 units. I will discuss how we do this modeling and why it failed in this case.

Background

Manufacturing Failure Modes

Classes of Manufacturing Defects

There are an endless variety of ways that we can categorize manufacturing defects. Here is the categorization I use:

    • connection failures

      Electronic assemblies often have thousands of interconnects between hundreds or thousands of parts. Every interconnection must be correct. It turns out that connection failures are easy to test for using shorts and opens tests. We actually have good metrics for our ability to detect this type of defect, which we call test coverage.

    • environmental failures

      Some failures only occur when the assembly is operated at specific temperatures. These failures can be found by testing the hardware at various temperatures. This can be done, but is expensive for high-volume products and it is often not done (we always do it).

    • speed failures

      Some failures only occur when a specific path in a circuit needs to operate at a certain speed and it cannot. Most of the time, there is a circuit path that have so much delay in them that they cannot switch fast enough (called a "long path"). There are also circuit paths that might be so fast that they do not have enough delay in them to switch properly (called a "short path"). These defects are difficult to test for and really must eliminated by using proper design practices. To provide some level of empirical assurance, we generally must test our systems over temperature using software that operates as similarly as possible to how the customer will use the hardware. This test will not catch every short path or long path problem, but it does ensure that most of the paths are tested. This testing is expensive, but it is the only way to catch most of these problems.

Combinatorial Explosion

As electronic systems become more complex, the difficulty of finding manufacturing defects grows much more difficult -- this growth in test difficulty is often referred to as the "combinatorial explosion". Every electronic system can be modeled as a state machine with a large number of state variables, inputs, and output. The complexity of this state machine so great that you cannot possibly test every possible combination of state, input, and output variable in an economically justifiable amount of time.

So much of manufacturing test focuses on the most likely failure modes, which normally involve interconnect failures. Interconnect failures would typically be caused by:

  • soldering problem

    Just today I saw a PCB that had two pins that were not soldered. It happens. We do use optical and x-ray inspection gear to minimize this type of defect.

  • contamination

    Most electronics manufacturing sites are very clean (Figure 1). However, contamination still happens.

  • Printed Circuit Board (PCB) defect

    PCBs do have flaws, but fortunately continuity testing by the PCB fabricators can minimize their occurrence. I do relate a personal story of a particularly difficult PCB problem I faced many years ago later in this post.

Stuck-At-Value Failure Modes

The most common failure modes tend to be of the type referred to as "stuck at" failures. There are a number of "stuck at" failure types:

  • stuck-at-0 (SA∅)

    A node is stuck at a logic "0" value.

  • stuck-at-1 (SA1)

    A node is stuck at a logic "1" value.

  • stuck-at-neighbor (SAN)

    A node is erroneously connected to a nearby node.

  • stuck-at-open (SAO)

    A failure mode usually seen with CMOS circuits, it occurs when a transistor fails in a way that is does not conduct current when it is supposed to, it is said to be stuck-at-open. This fault manifests itself as a high impedance state at the output node for a logic state and under certain conditions the node voltage stay "stuck" at its previous logic state. Because the circuit "remembers" its previous state, these failures are often referred to as memory failures.

The most economical failure modes to test for are the SA∅ and SA1. The following discussion focuses on these SA∅ and SA1.

Some Definitions

The following definitions will be used in the analysis to follow.

Yield
For the discussion here, yield is defined as the number of units passing our manufacturing test process divided by the number of units going into that process over a specified period of time.
Defect Level
Defect level is percentage of shipped units that customers find defective. Estimating your defect level requires monitoring your customer return data base very carefully and filtering out bogus failure reports. Many reports of customer failures actually have nothing to do with a problem with product manufacturing. I would argue that well over half of reported customer failures are actually customer training issues, which we call No-Trouble-Founds (NTFs). This rate of NTFs has been much the same at all the companies I have worked for (five companies at this point).
Test Coverage
The percentage of defects that can be found during manufacturing test versus the total number of possible defects. In many ways, test coverage is a bit of a fantasy. We have certain types of potential defects that we know and understand well enough that we can actual count them. For example, we can do very thorough shorts and opens test on PCBs.

However, I have seen many PCBs fail in use even though they passed a shorts and opens test. One of the most difficult troubleshooting tasks I have dealt with occurred at HP and involved PCB artwork with a tiny crack in a trace. This trace would become open under certain environmental conditions in the field. That took forever to track down because the problem occurred during a rare software operation and in a seemingly random manner. When we looked at that trace on the film, I remember wondering if something so small could cause a problem -- it turns out it did. This really taught me the importance of attention to detail.

Analysis

Objective

My objective here is to show you how sensitive this type of analysis is to the validity of the assumptions. I have plenty of evidence that supports the model I am about to present when all interconnect failure modes have roughly the same probability of occurrence. I will then discuss how the model completely fell apart when this assumption was violated. This is just a warning about modeling. To quote George E.P. Box, a famed statistician, “Essentially, all models are wrong, but some are useful.” We must always remind ourselves that models are used to provide us insight, but they do not necessarily reflect reality.

Defect Level Formula

I am going to apply a standard defect model for integrated circuits to electronic assemblies. The basic assumptions are the same and the resulting formula has modeled defect level for assemblies well for me in the past. I am not the only one to use this approach (example).

Equation 1 shows a commonly used model for chip-level defect level as a function of yield and test coverage. You often see companies modify Equation 1 to to make it fit there particular circumstances (e.g. Toshiba). In this post, I will be working with Equation 1 unmodified because I want to illustrate in general terms what happened in my particular situation.

Eq. 1 \displaystyle DL=1-{{Y}^{1-TC}}

where

  • DL is the defect level of our process.
  • Y is the yield of our process.
  • TC is the test coverage of our process.

Derivation

Figure 2 shows my derivation of Equation 1, which closely follow the derivation from this reference.

Figure 2: Derivation of the Defect Level Versus Yield and Test Coverage Formula.

Figure 2: Derivation of the Defect Level Versus Yield and Test Coverage Formula.

Google Book Reference

Graphical Result

Figure 3 shows a plot of Equation 1 for various yield and test coverage values. Observe how the defect level really starts to drop when you get your test coverage above 97%.

Figure 3: Graph of Defect Level Versus Yield and Test Coverage.

Figure 3: Graph of Defect Level Versus Yield and Test Coverage.

We routinely achieve test coverage levels above 99%, so I expect my defect level to be something around 1 in 10,000 units -- assuming all faults equally likely. Equation 1 is often plotted on different scales and it can look quite a bit different (see Appendix A).

When the process issue occurred and our tests did not catch it, the defect level now was approximately the same as that of the process issue. All of a sudden, I saw my defect level grow.

Fortunately, we found the problem and I now see my defect level down where I expect it to be.

Conclusion

Because we had a process problem that occurred much more than any other and that problem was not detected by our tests, that problem went out to customers at the same rate it occurred in the factory. We discovered the issue and put in a test that would catch this case, but I am left feeling a little uncomfortable by the whole affair. I am reminded of a quote from one of the Bernoulli boys (Jacob, Danial, or Johann -- I forget which) about finding an error in a proof, "If there is one tiger in the forest, might not there be more."

Appendix A: Example Use of Equation 1

You will often see Equation 1 graphed on different scales, which makes it hard to identify. The following figures illustrate what I mean. Figure 4 is from Toshiba ASIC Design Guide. Using the same scale, I plotted the same function in Figure 5 using Mathcad. They are the same.

Toshiba View of the Defect Level Equation.

Figure 4: Toshiba View of the Defect Level Equation.

My Graph of Equation 1

Figure 5: My Graph of Equation 1

Posted in Electronics | 1 Comment

Budgeting for an Air Conditioner

Quote of the Day

When we read, we start at the beginning and continue until we reach the end. When we write, we start in the middle and fight our way out.

- Vickie Karp, writer. I use the same technique when I am working through a mathematical/software concept.


Figure 1: Roof Top Air Conditioner.

Figure 1: Roof Top Air Conditioner.

Every quarter I have to forecast my need for capital equipment, which includes things like air conditioners for our lab. I just recently added 20 kW of capacity electrical capacity to the lab by ordering some energy-saving air conditioning units from National Air Warehouse. Other lab users have probably added another 20 kW of electrical capacity to the lab.

Since I am conservative by nature, I will assume that all this electrical power is going to be used and will end up as heat dissipated in the lab. So I am estimating that we have added 40 kW of heat load to the lab, which means I should provide sufficient air conditioning capacity to cool that load (Figure 1 shows a common type of commercial, roof-top, air conditioner [source]).

I know that my current air conditioner capacity just barely meets our cooling needs during the summer. I will be adding equipment to the lab during the coming winter and I will not need the extra cooling capacity during the winter because we can just bring in more outside air -- I live in Minnesota and getting cold air in the winter is not a problem. Speaking to a friend about this issue, he highlighted that talking to professionals from websites like blairsair.com could give me some perspective on how to tackle my air conditioning capacity issue. However, I must add the cooling capacity before summer comes. Also, by using the air conditioner I knew it would require greater maintenance. Looking for the right trusted company was a task as there are just so many! In the end, I came across, http://www.gohomeheating.com/ID/Twin-Falls.php, who offer a solution for Air Conditioners to ensure my premises is kept nice and cosy in the winter months!

In the US, commercial air conditioner capacity is specified in tons of cooling. We can convert from 40 kW to tons of cooling by performing the following calculation (Figure 2).

Figure 2: kW to Tons of Cooling Calculation.

Figure 2: kW to Tons of Cooling Calculation.

It looks like I need to add about 12 tons of cooling capacity before next summer. I will call a local air conditioner shop and find out the cost of this air conditioning capacity and put it in my budget. I might also consider having a heating and air conditioning repair person around. Always a good idea to be prepared for the worst.

Posted in Construction, General Science | 1 Comment

Cost of Optical Fiber Versus Kite String

Quote of the Day

Until lions have their historians, tales of the hunt shall always glorify the hunter.

- West African proverb


Figure 1: Example of a Multi-Fiber Cable.

Figure 1: Example of a Multi-Fiber Cable.

I try to help customers develop some perspective as to the cost of deploying fiber optic cable. Each cable can carry multiple fibers (see Figure 1). Customers will frequently ask about the incremental cost of adding an additional fiber to a cable they are about to deploy, which is often called the marginal cost of a fiber. While I cannot tell you specific costs of different fiber optic cables because of confidentiality restrictions, the following quote from this document will give you a rough idea of the marginal cost of adding a fiber to a cable.

Some communications providers have excess fiber strands. Fiber count in cables ranges from 6 to 24 near residences and individual businesses to more than 1,000 on backbone routes. The cost of a 6-count fiber cable is $2,000 per mile, while an 864-count cable is $50,000 per mile, implying a marginal cost of approximately $50 per fiber per mile. Actual costs for fiber purchase or lease, of course, reflect market costs and depend on the total availability of fiber over the route–and are thus, typically, considerably higher; however, fiber lease or purchase may be a serious consideration over routes where construction is difficult or costly and considerable fiber has already been installed (e.g., river crossings, tunnels).

I tell customers that they should make sure they have plenty of fiber in a cable when it is deployed because adding it later is much more expensive (i.e. you need to put in another cable). I often suggest that they shop around for the best fiber optic cable suppliers, such as Vchung.com, before buying.

$50 per mile for optical fiber is very cheap. To illustrate just how cheap $50 per mile is, I show customers that kite string actually costs more per mile than fiber optic cable with the following link. This link shows that kit string costs $5.38 per 500 ft (Figure 2) or about $54 per mile, which is more than optical fiber.

Figure 2: Kite String Cost.

Figure 2: Kite String Cost.

Posted in Fiber Optics | Comments Off on Cost of Optical Fiber Versus Kite String

Sharks a Hazard For Submarine Cables

Quote of the Day

There is nothing more difficult to take in hand, more perilous to conduct, or more uncertain in its success, than to take the lead in the introduction of a new order of things.

— Niccolo Machiavelli


I have spent my share of time on a ship dealing with electronics being operated underwater -- it is never easy or simple. It is easy to forget that there are creatures down there that also may want to cause you trouble. Figure 1 is a video showing a shark chomping a fiber optic communication cable (source).

Figure 1: Shark Chomping on a Fiber Optic Cable.

Problems like this have been reported since the first transatlantic cables were laid in the 1800s. Here is a quote from this article about a situation back in the 1980s.

We’ve long known squirrels are a major problem to anyone laying cable, but according to a report by the International Cable Protection Committee cable bites—by sharks and other fish—remain a surprisingly persistent problem. In the 1980s, a deep-ocean fiber-optic cable was cut four times. Researchers blame crocodile sharks for those attacks after finding teeth in the cable.

I have never heard more than mere speculation as to why the sharks go after the cables. Here is an excerpt from the New York Times. This excerpt mentions that sharks are very sensitive to electromagnetic (EM) fields. When I was a boy, the news articles used to mention a fish's lateral line as being sensitive to EM fields.

Also, some researchers believe there may be something unusual about the electrical current in the fiber-optic lines that attracts sharks and that may trigger an automatic feeding reflex.

The finding that sharks are supersensitive to electrical signals, able to detect electric fields as faint as a few millionths of a volt per centimeter in water, is a recent significant discovery in marine science, Dr. Nelson said.

The sharks may detect a faint field near the cable and attack. ''Not knowing any better, they try to eat it,'' Dr. Nelson said. ''It's programmed in their genes. Whether the field comes from a cable or from a tin can, sharks are prone to behave as if they were encountering a food item, and try to eat it up.''

Some folks have asked me why a fiber optic cable would have EM field around them. The cables that I have dealt with all had internal copper wire that carried high voltage (~8 kV) to power optical amplifiers within the cable that were mounted every 30 km or so. So it is conceivable that there are significant fields around these cables. Figure 2 (source) shows a submarine cable with amplifiers (aka repeaters) in it.

Figure 1: Illustration of a Fiber Optic Cable with Repeaters.

Figure 2: Illustration of a Fiber Optic Cable with Repeaters. (Source)

The Wikipedia also discusses sharks biting cables.

After AT&T installed the first deep sea fiberoptic cable between Gran Canaria and Tenerife in the Canary Islands in September 1985, the system suffered a series of shorts that necessitated costly repairs. It was discovered that attacks from the crocodile shark were responsible for most of the failures, possibly because they were attracted to the electric field around the cables. Since crocodile sharks are not benthic in nature, they were presumably biting the cables as they were being deployed. The problem was solved by protecting the cables with a layer of steel tape beneath a dense polyethylene coating.

Figure 3 shows what a crocodile shark looks like (source).

Figure 3: Wikipedia Photo of Crocodile Shark.

Figure 3: Wikipedia Photo of Crocodile Shark. (Source)

Save

Posted in Fiber Optics | 1 Comment

Compound Miter Cuts Without Any Formulas

Quote of the Day

I refer to that time as their second bottle phase.

— My mother on the teenage years of her children. My brothers did down one or two beers 🙂


You will find many carpentry web sites that give formulas for determining the cut angles for compound miter cuts (example). This is always a painful exercise because it is hard to set the saw angles just right. I watched this video that has an elegant solution to the problem.

If you want to read the article associated with the video, see this location. You can also try this PDF.


Posted in Construction | 7 Comments

Massive Bandwidth to Come From Wavelength Division Multiplexing and Coherent Communications

Quote of the Day

Conformity is the jailer of freedom and the enemy of growth.

- John F. Kennedy


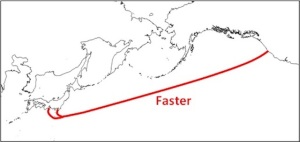
Figure 1: 10,000 km Path of FASTER Submarine Cable.

Figure 1: 10,000 km Path of FASTER Submarine Cable.

In the past decade, we have seen a massive growth in the need for fast bandwidth. Modern businesses have higher bandwidth requirements due to the amount of data they use and consume so they are having to discover new technology, like SD-WAN, that can meet these requirements without spending too much money. And now, there have been some very interesting developments with some of the biggest companies in the world addressing these issues and investing in interesting ways to combat it. I was just reading an article on the FASTER project, which is a submarine cable project that will deliver an initial information capacity of 60 Terabits Per Second (Tbps) between the US and Asia. This is substantially more than the 4 Tbps we typically see today in these systems (example). It does this by extensive use of Wavelength-Division Multiplexing (WDM), with each wavelength carrying 100 Gigabits per second (Gbps) over a six-pair cable. The overall design capacity of this system is given by the following calculation:

Eq. 1 \displaystyle 60\text{ }\frac{\text{TB}}{\text{s}}=\frac{\text{100 wavelengths}}{\text{fiber-pair}}\cdot \frac{100\text{ Gb}}{\text{wavelength}\cdot \text{s}}\cdot 6\text{ fiber-pair}

The cable will run a distance of 10,000 km between Japan and the US (Figure 1).

I have worked on submarine cables (late 1980s) and it is very interesting technology. If you are interested in some general information on submarine cables, this article is good. The Wikipedia maintains a list of submarine cables and you can see that there are a lot of them. If you want to get some details on a typical submarine fiber cable system, see this Wikipedia article.

There are two key technologies involved here:

    • Wavelength Division Multiplexing

      The ability of fiber to carry multiple wavelengths at the same time makes this an obvious approach for increasing bandwidth. Unfortunately, it generally requires precise temperature control of the lasers to ensure that their wavelengths stay in their assigned "lanes".

    • Coherent Communications

      The vast majority of the deployed optical systems today are Non-Return-to-Zero (NRZ) encoded ? a "1" equals laser on and a "0" equals laser off. I am now seeing more and more use of coherent optical transports. See this article for a reasonable briefing on the topic. If you want to see an example of the hardware, check out this web site (a shout-out to my friend Mike Wirtz, who works there).

The combined use of WDM and coherent communications can provide an enormous increase in the bandwidth of a communication system.

I currently work on Fiber-To-The-Home (FTTH) systems (GPON, EPON, and Active Ethernet) that are delivering 1 Gbps to homes. As these systems become more widely deployed, the Internet backbone will need a major bandwidth upgrade to support aggregating the bandwidth increases occurring at the edges of the network. And the pressure on the Internet backbone is only going to increase. For example, while current GPON systems support 2.488 Gbps downstream and 1.244 Gbps upstream, NGPON2 is coming and will provide 16 channels of 10 Gbps bandwidth. This is on residential and business fiber lines!

Unfortunately, I still struggle at my home with the very limited service provided by a cable network. Someday I hope to enjoy for myself the service that I work on developing every day.

Posted in Fiber Optics | 1 Comment

Waveguides and Plumbing

Quote of the Day

History is a trick we play on the dead.

- Voltaire


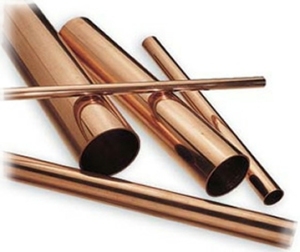
Figure 1: Examples of Copper Pipe.

Figure 1: Examples of Copper Pipe.

I worked as an engineering intern at Medtronic during the summer between my Junior and Senior years at the University of Minnesota. I worked with some wonderful people there too. Some of them were young and some near the end of their careers. I was always fascinated by how things work and it was this curiosity that made me Consider a career in plumbing. Those days were some of the absolute best and I will never forget everything that I learned along the way. One of the older gentlemen there was a World War 2 veteran who had worked on radar systems during and after the war. He used to tell me that assembling those systems made him as good as one of the Beaverton plumbers. He should put his skills to good use soon enough. When it came to learning about plumbing, he was full of tips and tricks for me such as the importance of lining pipes. You can learn about epoxy pipe lining here if you're interested in finding out more. When I asked what the link between plumbing and radar systems was, he said that many of the waveguides were made of copper pipe (Figure 1) that was similar to that used for distributing water within homes in the US. His knowledge may match the knowledge of a service like Maryland Plumbing.

I never thought much about what he said until I read this article about the history of 50 coaxial cables being used in Radio Frequency (RF) applications. Here is the quote that got me thinking about copper pipes and waveguides.

The most common story is that 50-ohm high power coaxial lines were first made using standard sizes of copper pipe, such as 3/4 inch for the inner conductor and 2 inch for the outer conductor. While this may explain why certain transmission lines are 52 or 53 ohms versus 50 ohms, I don't think this is the entire story of how 50 ohms became the most common standard.

I thought I would do a quick calculation here and check this statement out. I grabbed the formula for the characteristic impedance of a coaxial structure from the Wikipedia and performed the calculation shown in Figure 2.

Figure 1: Characteristic Impedance of a 3/4 inch Copper Pipe inside of a 2 in Copper Pipe.

Figure 2: Characteristic Impedance of a 3/4 inch Copper Pipe inside of a 2 in Copper Pipe.

It does look like the computed characteristic impedance of this coaxial configuration of common plumbing pipe is about 50 ?.

For another reference that discusses using common copper plumbing pipe for a waveguide, see this article. Figure 3 shows the inner and outer diameters of common copper pipe sizes (source). Type M pipe is the most commonly seen.

Figure 3: Inside and Outside Diameters of Common Copper Pipes.

Figure 3: Inside and Outside Diameters of Common Copper Pipes.

Posted in Electronics | Comments Off on Waveguides and Plumbing

Coaxial Cable Temperature Expansion Rate

Quote of the Day

Great leaders are almost always great simplifiers, who cut through argument, debate and doubt to offer a solution everybody can understand and remember.

— Michael Korda


Introduction

Figure 1: Coaxial Cable is installed in 90% of North American Homes.

Figure 1: Coaxial Cable is installed in 90% of North American Homes.

I have been talking to contractors who install Fiber-To-The-Home (FTTH) products and they frequently have more questions about the electrical cabling than the fiber cabling. Today, I had an installer ask me a good question about coaxial cable (example shown in Figure 1). His question was:

How much does the length of coaxial cable change with temperature?

This is an interesting question because I have seen deployments run into reliability issues because the length changes were not accounted for when the cable was deployed. The solution is to include expansion loops when using coaxial cables. I consider these loops similar to what others call service loops.

The answer depends on how you define the length of the cable. The discussion was interesting and I thought worth documenting here. It will be similar in tone to this post, which discusses the thermal expansion of PVC. I have also discussed how the length of fiber optic cable varies with temperature in this post.

Background

My focus in this post will be on deriving a useful rule of thumb on the amount of length change an outdoor-mounted, unburied, coaxial cable will experience based on air temperature changes. Buried coaxial cable experiences minimal length changes because the temperature variation of the soil is less than that in air.

Coaxial Cable Construction

Figure 2 shows a cutaway drawing of a typical coaxial cable. There are many kinds of coaxial cable. For this post, I will focus on RG-6 cable because it is the most deployed cable in modern residential deployments.

Figure X: Coaxial Cable Cutaway Drawing.

Figure 2: Coaxial Cable Cutaway Drawing.

As shown in Figure 2, coaxial cable is composed of the following parts:

  • center core

    This a round, 18 AWG, copper wire.

  • delectric insulator

    This is normally a plastic called PTFE, one formulation of which is commonly known as Teflon. As we all know, Teflon(TM) does not stick to much. Since copper and the PTFE have different coefficients of thermal expansion (CTE), this means the wire moves relative to the dielectric.

  • metallic shield

    This is usually an aluminum braid. Aluminum also has a different coefficient of thermal expansion than PTFE or copper. In general, this material does not cause movement issue because the braid is fabric-like and, therefore, flexible.

  • plastic jacket

    This can be composed of any number of plastic materials. It generally is very thin and flexible, which means that its movement does not really cause any issues.

My discussion will focus on the expansion of the copper and dielectric materials because they are quite rigid and tend to push and pull on whatever they are mounted to.

Why do we care how much the length changes?

There good and bad aspects to the fact that the length of coaxial cable changes with temperature. Here is a brief discussion.

Good Aspects

The core copper conductor in coaxial cable will move independently of the rest of the cable. This relative movement can cause the contact area between the wire and its termination to rub, which can be useful in keeping the electrical contact area clean. Here is an excerpt from this reference that discusses the movement.

The movement of the center conductor occurs when the cable heats up, and cools down with normal temperature changes. The coefficient of expansion is different for the center conductor verses the shield of the cable and that difference keeps the center conductor moving back and forth slowly to keep the contact area clean.

Bad Aspects

The fact that the length changes means that the installers must account for this movement. Because RG-6 can be quite stiff (especially the quad-shield version), the cable may push and pull hard on the electronics it is connected to. This movement can cause the electronics to flex, which may result in reliability problems over time. A good installation will ensure that cable movement will not put stress on the electronics it is connected to.

Analysis

My focus in this post is to create rule of thumb for installers that will help them understand the amount of cable movement they can expect to see. Since the copper and dielectric in coaxial cable move independently, it is important to understand how each material's length changes with respect to temperature.

Coefficients of Thermal Expansion

Table 1 shows typical expansion coefficients for materials that comprise a coaxial cable. Since these materials are not rigidly attached to one another, they can move independently.

Table 1: Coefficients of Thermal Expansion
Material Value Units
Copper 16.5 μm/ (m⋅K)
PTFE 135.0 μm/ (m⋅K)
Aluminum 23.1 μm/ (m⋅K)

While I list the CTE for aluminum in Table 1, it really does not come into play for installation issues. The aluminum is woven in the form of a braid and it is flexible. So my discussion below will focus on the copper and PTFE CTEs.

Expansion Rules of Thumb

Figure 3 summarizes my thermal expansion calculations. Based on these calculations I can create the following rules of thumb:

  • The copper core can move ~0.25 inches for every 25 feet of RG-6 cable during a typical year (i.e. 100 °F temperature)
  • The dielectric can move ~2.5 inches for every 25 feet of RG-6 cable during a typical year (i.e. 100 °F temperature).
Figure 3: Expansion Calculations for 25 foot and 100 foot Cables Over 100 °F Temperature Change.

Figure 3: Expansion Calculations for 25 foot and 100 foot Cables Over 100 °F Temperature Change.

Conclusion

Engineers often have to prepare installation guidelines for the folks who install the gear they design. It is always important to make sure the installers understand why they are doing things. This will give you a much greater likelihood of having your products installed correctly.

Posted in Electronics | 3 Comments