Example of a Useful Histogram

Sometimes all it takes is to use a histogram maker to create a graph, for example, to help provide you the clue you need to solve a mystery. Currently, I am working on reducing the failure rate of Avalanche Photo-Diodes (APDs). I found a histogram was useful in my work and I thought I would share it.

APDs are sensitive light detectors. In fact, some can detect individual photons. In my case, APDs are a critical component in the receiver circuit of an optical network. To achieve maximum sensitivity, APDs require a specific voltage be placed across them, which we call the bias voltage. We determine this voltage for each APD during manufacturing through a process we call calibration. The calibration process uses a steepest descent algorithm to the determine the bias voltage that provides maximum sensitivity.

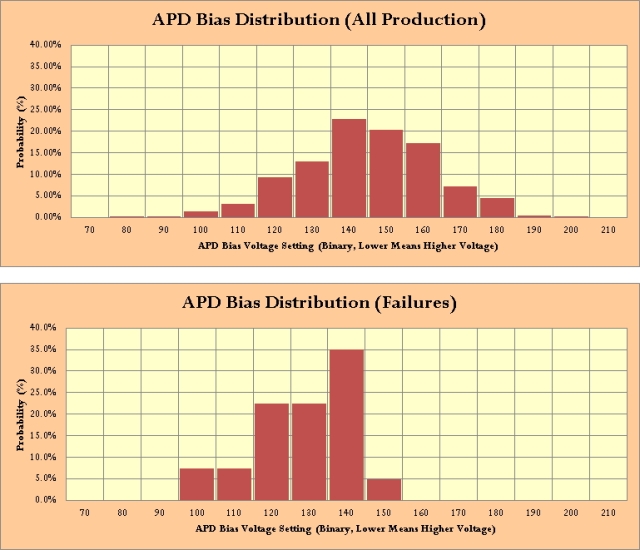
My APD failure rate is too high (still less than 1%) and I need to find out why. I was not making much progress, but then I decided to generate a histogram of APD bias voltages of the failed units and of the general population of APDs we have shipped. This histogram is shown below.

Figure 1: Histograms of APD Bias Voltage for All Units and Failures.

Figure 1: Histograms of APD Bias Voltage for All Units and Failures.


You can see in Figure 1 that the failed units have APD bias voltages that are in the high range of the overall population (high voltage implies low binary setting). I shared this figure with a co-worker and we began discussing why this could be the case. Within a few minutes, we had a number of potential failure causes to check out. I now believe we are on our way to solving our mystery.

I often find myself looking for patterns and regularities in data. Graphs are one of the key techniques we use to see these patterns. In this respect, I do find myself drawn to the work of Tufte. I don't agree with everything he says, but there is a lot of material there that makes me think.

Posted in Electronics | Comments Off on Example of a Useful Histogram

Candle Flame in Space

Quote of the Day

Only enemies speak the truth. Friends and lovers lie endlessly, caught in the web of duty.

— Stephen King


I saw this photo posted by Robert Frost here. It shows a flame on Earth (left) and a flame in space (right). Very cool ...
Candle Flame in Space

Posted in Astronomy, General Science | Tagged | Comments Off on Candle Flame in Space

World War 2 Industrial Casualties

Quote of the Day

Solomon had 300 wives and 700 porcupines.

- Kevin Kling, quoting a little boy in a religion class describing Solomon.


Introduction

Figure 1: Poster Encouraging Job Safety.

Figure 1: Poster Encouraging Job Safety (Source).

I like to watch authors discuss their history books on BookTV. I listen to BookTV while I work around the house. One weekend, I heard two historians (I did not write down their names) discussing World War 2 and each mentioned a statistic that sounded something like this (my wording).

During World War 2, the US took the better part of 18 months to build its military-industrial base after Pearl Harbor. Building this industrial base had its own cost in lives. In fact, the number of US military personnel killed in action each year did not exceed the number of US industrial deaths each year until sometime in 1943.

I had never considered the number of people that were dying on the home-front building the armaments needed to fight World War 2. I thought that I should be able to fact check this statement – work that I document in this post.

Background

I did a quick web search and found the following sources.

  • This post consists of grabbing this data, cleaning it up, and summarizing the results in a pivot table.

    If you want to see how I processed the data, here is my spreadsheet.

    Analysis

    The historians were correct if you strictly take casualties listed as Killed in Action (KIA) or air combat deaths. To keep things simple, I focused on the data for the US Army, Navy, and Marines – I could not find yearly Coast Guard data, but did find yearly Merchant Marine data (shown in the attached spreadsheet). I grabbed all the KIA data on the pages listed above and generated a pivot table (Table 1), which I show below. The casualties in war are never-ending and it can be jarring to see on paper. People want to show their support for those who serve by honoring their memory, whether that be flying marine corp flags outside their homes to attending the ceremonies that happen throughout the year. All we can say is that those KIA are never forgotten, on paper or in the mind. One could never know how big their sacrifice is and they will always be remembered by the country and their loved ones (through Toledo Blade obituaries or similar others), for their valour and conviction.

    It was during 1943 that the number of military KIA exceeded the number of workers dying in factories. The table also shows that military casualties really surged during 1944, which makes sense when you think of D-Day and the increasing tempo of operations in the Pacific War. Note that the official records list some deaths as occurring in 1946. I have included these deaths in 1945, which is why I label 1945 with a plus.

    Table 1: US Army, Navy, and Marine World War 2 Killed in Action Statistics.

    Year

    Army

    Marines

    Navy

    Military KIA

    Factory Deaths

    1941

    467

    99

    2,181

    2,747

    18,000

    1942

    4,497

    1,239

    2,890

    8,626

    18,500

    1943

    19,548

    1,732

    4,839

    26,119

    17,500

    1944

    107,437

    5,892

    8,187

    121,516

    16,000

    1945+

    57,747

    8,414

    15,907

    78,678

    16,000

    Totals

    189,696

    17,376

    34,004

    237,686

    85,500

    I would argue that these numbers are not really fair because there are many other battle deaths not listed as KIA. I get Table 2 if I count all the battle and non-battle-related deaths, and you can see the military deaths swamp out the civilian deaths in 1942.

    Table 2: US Army, Navy, and Marine World War 2 Battle and Non-Battle Killed Statistics.

    Year

    Army

    Marines

    Navy

    Military KIA

    Factory Deaths

    1941

    493

    165

    2,217

    2,875

    18,000

    1942

    17,612

    1,607

    3,278

    22,497

    18,500

    1943

    22,592

    1,839

    5,251

    29,682

    17,500

    1944

    126,170

    5,746

    9,348

    141,264

    16,000

    1945+

    68,007

    10,376

    16,856

    95,239

    16,000

    Totals

    234,874

    19,733

    36,950

    291,557

    85,500

    These totals agree with those reported by the Wikipedia. For total Army, Navy, and Marine casualties, see Appendix B.

    The US Marine's listed their casualties by battle and not by year. I obtained the list of US Marine casualties by year from a book quote on a forum post (see Appendix A).

    Conclusions

    Here is what I learned from this data:

    • US factory work in the early 20th century was dangerous.
      • For comparison, there were 4,679 fatal work injuries in the US during 2014.
      • There were ~149 million employed workers in the US during 2015. (Source)
      • There were ~53 million employed workers in the US during 1945. (Source)
      • Roughly, there was more than 3 times the number of fatal work injuries with a workforce ~1/3 the size.
    • 48% of all US military KIA occurred during 1944.
      • The number of KIA in 1945 was lower than in 1944 because most of the fighting ended by June 1945.
      • 1945 casualty rates dropped enormously after the Battle of Okinawa and VE day.
    • The size of the European theater was massive compared to the Pacific theater.
      • Just look at the US Army casualties after D-Day. The US Army in July 1944 had 16.8K soldiers killed, where the US Marines lost 19.7k for the entire war.

    Appendix A: US Marine Casualties By Year

    I was able to find a forum post that summarized the Marines casualties by year using data from the book The US Marine Corps Story (ISBN 0316585580). Table 3 summarizes this information.

    Table 3: Marine World War 2 Killed in Action Statistics.

    Year

    Killed

    Wounded

    Captured

    Missing

    Total Casualties

    1941

    165

    80

    740

    0

    985

    1942

    1,607

    3,336

    1,292

    85

    6,320

    1943

    1,839

    4,996

    0

    27

    6,682

    1944

    5,746

    21,078

    0

    117

    26,941

    1945+

    10,376

    37,717

    238

    0

    48,331

    Totals

    19,733

    67,207

    2,270

    229

    89,439

    Appendix B: Battle and Non-Battle Casualties

    Table 4 shows the total Army, Navy, and Marines casualties during WW2 (Source). Note that there were a significant number of non-battle related casualties. This is true in all conflicts.

    Table 4: US Army, Navy, and Marines WW2 Casualty Summary.
    Service Total Serving Battle Deaths Non-Battle Deaths Total Deaths Wounded
    Army 11,260,000 234,874 83,400 318,274 565,861
    Navy 4,183,466 36,950 25,664 62,614 37,778
    Marines 669,100 19,733 4,778 24,511 67,207
    Totals 16,112,566 291,557 113,842 405,399 670,846

    Appendix C: Industrial Casualty Table.

    Figure 2 is my screen capture of the government's data on factory deaths (Source).

    Figure M: Screen Capture From Google Books on Industrial Casualties.

    Figure 2: Screen Capture From Google Books on Industrial Casualties.

    Appendix D: Alternate Industrial Casualty Reference.

    Figure 3 is my screen capture from The Cambridge History of the Second World War: Volume 3, Total War: Economy, Society and Culture (Link). The data in this post is consistent with this reference.

    Figure 3: Alternate Reference on Industrial Casualties.

    Figure 3: Alternate Reference on Industrial Casualties.

Posted in History of Science and Technology, History Through Spreadsheets, Military History | 24 Comments

Another Interpretation of the Ballistic Coefficient

Introduction

I love to look for physical interpretations of various constants. Sometimes it is impossible to come up with an interpretation, but such is not the case for the ballistic coefficient. This morning I read a very solid piece of technical work on the ballistic coefficient that has another interpretation that I have not seen before (Source). Here is a statement they made that I will support with a quick derivation.

To a rough approximation, the BC [ballistic coefficient] can be estimated as the fraction of 1000 yards over which a projectile loses half of its initial kinetic energy. In other words, a bullet with a BC of 0.300 should lose roughly half of its initial kinetic energy at a range of 300 yards.

This statement is very interesting in a number of ways:

  • Can I derive it using the expressions from Pejsa's book "Modern Practical Ballistics"?
  • What do they mean by "rough approximation"?
  • Does this approximation work with bullets that have a ballistic coefficient greater than 1?

I will address all three questions in this post. Let's dig in ...

Background

The ballistic coefficient is a very old school concept -- the ballistic coefficient is the ratio of a projectile's deceleration due to drag compared to the deceleration due to drag for a reference projectile of the same shape. Modern projectile simulation software would use different approaches (see McCoy). For my purposes here, we will define the ballistic coefficient C as shown in Equation 1.

Eq. 1 C\triangleq \frac{{{a}_{\text{Ref}}}}{{{a}_{\text{Projectile}}}}

where

  • aRef is the deceleration of a reference projectile.
  • aProjectile is the deceleration of our projectile under test.

Analysis

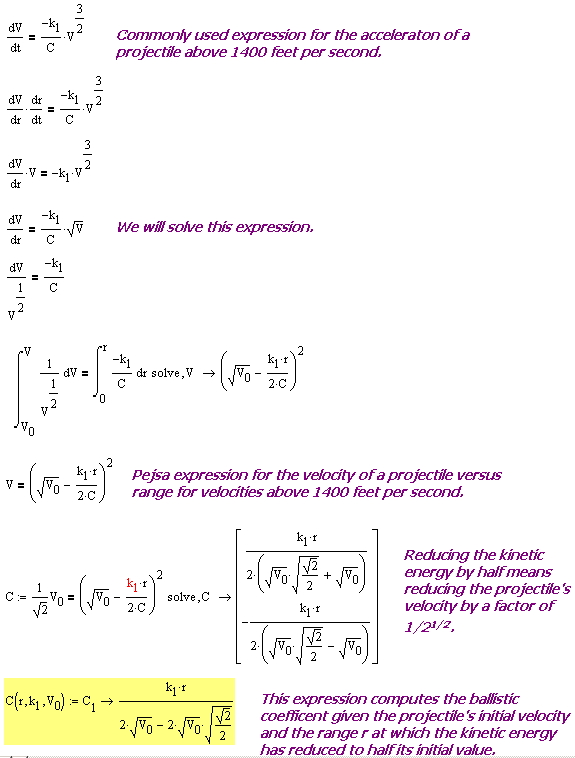
Figure 1 shows my derivation of an expression for the ballistic coefficient as a function of projectile velocity and range. The derivation presumes that reducing the kinetic energy by a factor of 2 means a velocity reduction by the \sqrt{2}.

Figure 1: Derivation of an Expression for the Ballistic Coefficient.

Figure 1: Derivation of an Expression for the Ballistic Coefficient.

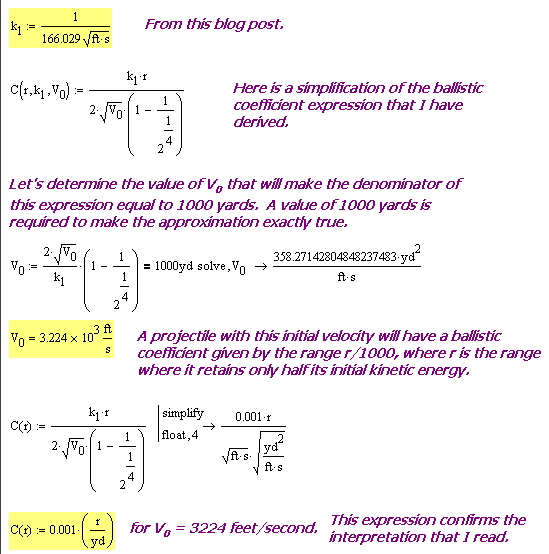
Figure 2 complete my confirmation of the approximation. The approximation is exactly true for projectiles with an initial velocity of 3224 feet per second. It is approximately true for initial velocities near 3224 feet per second, which is common for high-velocity rifle projectiles.

Figure 2: Verification of the Approximation.

Figure 2: Verification of the Approximation.

Conclusion

Let's review my answers to the questions I presented in my Introduction.

  • Can I derive it using the expressions from Pejsa's book "Modern Practical Ballistics"?

    See Figure 2.

  • What do they mean by "rough approximation"?

    It is only exactly true for projectiles with an initial velocity of 3224 feet per second. It is only roughly true for initial projectile velocities near 3224 feet per second.

  • Does this approximation work with bullets that have a ballistic coefficient greater than 1?

    It is not too bad for a battleship projectile. Using the approximation and the range table here, I get that the 16 inch ballistic coefficient is ~13 (actual value of ~15). Not too bad considering the initial velocity is 2577 feet per second instead of 3224 feet per second.

Posted in Ballistics | 9 Comments

16-in Battleship Gun Ballistic Coefficient

Quote of the Day

Criticism may not be agreeable, but it is necessary. It fulfills the same function as pain in the human body. it calls attention to an unhealthy state of things.

— Winston Churchill


Introduction

Figure 1: Mk 13 HC (High Capacity) 16-inch Shells.

Figure 1: Mk 13 HC (High Capacity) 16-inch Shells.

I received the following question on one of my earlier blog posts:

Naval guns claim a range of up to 16 miles, and apparently do so with an initial velocity of only approx. 3000 fps [, which is similar to rifle bullet]. how is this possible[?]

You can view my answer on that blog post, but I started to think about alternative, but equivalent, ways to answer this question. From a numerical standpoint, one way to answer his question is by comparing the ballistic coefficient of a 16-inch projectile (Figure 1) to that of a standard firearm projectile. A projectile with a large ballistic coefficient is less affected by drag than a projectile with a smaller ballistic coefficient. We can use the the ballistic coefficient to compare the effect of drag on different projectiles. A 16-inch projectile goes so much farther than a rifle bullet because the drag on the 16-inch projectile is relatively small compared to its momentum. Ultimately, this is because mass increases by the cube of the projectile dimensions and drag increases by the square of the projectile dimensions. This means that larger projectiles tend to have higher ballistic coefficients and drag has less effect.

Let's put some numbers together ...

Background

The Wikipedia defines the ballistic coefficient as follows:

Ballistic Coefficient
The Ballistic Coefficient (BC) of a body is a measure of its ability to overcome air resistance in flight. It is inversely proportional to the negative acceleration — a high number indicates a low negative acceleration.

A projectile with a small deceleration due to atmospheric drag has a large BC. Projectiles with a large BC are less affected by drag and have performance closer to their performance in a vacuum.

While the Wikipedia definition is accurate as far as it goes, it does not allow you to compute the BC of a projectile. Equation 1 shows you how to compute the BC of any projectile.

Eq. 1 \displaystyle B{{C}_{\text{Projectile}}}\triangleq \frac{{{a}_{\text{ReferenceProjectile}}}}{{{a}_{\text{Projectile}}}}

where

  • aReferenceProjectile is the acceleration of a reference projectile (eg. G7).
  • aProjectile is the acceleration of the projectile we are interested in.

Analysis

I will compute the BC of the US Navy's 16-in, high-capacity (1900 pound) shell that was fired by the Iowa-class battleships using a couple of different methods.

  • Estimate the deceleration of the battleship projectile and compute Equation 1.
  • Apply a geometry-based formula.

Both methods give similar answers.

Method Based on Deceleration Estimate

To estimate the 16-inch projectile's deceleration. There is data available for this. Figure 2 shows a snippet from a US Navy range table for the 16-inch projectile (Source).

Figure 1: Snippet from 16-inch Projectile Range Table (1900 lb).

Figure 2: Snippet from 16-inch Projectile Range Table (1900 lb).

For my BC estimate calculation (Figure 3), I will use only the forward velocity component because that component is experiencing the bulk of the drag.

Figure 2: Ballistic Coefficient Calculation Using Deceleration Data.

Figure 3: Ballistic Coefficient Calculation Using Deceleration Data.

How to Compute Acceleration

Ballistic Coefficient Calculation Using Formula

Figure 4 shows the ballistic coefficient calculation using a geometric formula that compares the 16-inch projectile to a 30-06 projectile (Ball, M2, 152 grain, 0.308 in diameter).

Figure 4: Computing the BC of a 16-inch Projectile Using a Formula.

Figure 4: Computing the BC of a 16-inch Projectile Using a Formula.

Conclusion

Here is a quote that supports my analysis from "Modern Practical Ballistics" on page 115 (ISBN 0-96212776-3-7).

Modern long-range guns like the US Navy's 16-inch guns are able to attain ranges in excess of 25 miles using an initial elevation angle near 45 degrees; their shells reach an altitude of approximately seven miles. Although their muzzle velocities are generally only about 2600 to 2800 fps, their enormous size and weight -- in excess of 2000 pounds -- gives them ballistic coefficients of around 15, which are 30 to 50 times as great as small arms projectiles!

Posted in Ballistics | 5 Comments

Parameter Determination for Pejsa Velocity Model

Quote of the Day

Character, in the long run, is the decisive factor in the life of an individual and of nations alike.

— Theodore Roosevelt


Introduction

Figure 1: Picture of Pejsa Book Cover.

Figure 1: Picture of Pejsa Book Cover (Source).

I have had several people ask me questions about the Pejsa ballistic model (previous post) and I thought it would be useful to include some additional posts on the topic. In this post, I will discuss how the formula and parameters were determined for the velocity versus range formula for the range of velocities from 1400 feet per second to 4000 feet per second – sorry about the use of US customary units. Pejsa's formula were setup specifically to used ranges in yard, velocities in feet per second, and projectile drops in inches.

I do recommend that folks read through Pejsa's book (Figure 1) for themselves. Unfortunately, it is not an easy read and the formulas derived are not as general as I would like. The main issue with the formulas are that they are quite specific to US customary units – e.g. the fact that one yard equals three feet is used in final formulas. Also, some of the approximations assume a specific range of ballistic coefficients. However, the formulas are very useful because they provide accurate answers to common ballistic situations using simple algebraic formulas.

Background

For background, see this post. Pejsa provides different formulas for the variation of projectile velocities with respect to range based on the projectile's velocity. In this post, I will only address his formula for projectile velocities greater than 1400 feet per second. In later posts, I will work through the lower velocity ranges.

Analysis

Derivation

Figure 2 shows how one can derive Pejsa's velocity versus range formula for the velocity range of 1400 ft/s to 4000 ft/s.

Figure 1: Derivation of Pejsa Velocity Versus Range Equation.

Figure 2: Derivation of Pejsa Velocity Versus Range Equation.

Drag Coefficient

Parameter Determination

Figure 3 shows how to determine the single constant factor, K1, in the Pejsa equation.

Figure 2: Determine K1 Using Empirical Data.

Figure 3: Determine K1 Using Empirical Data.

Verification

One question involved how to generate a plot of the rate of velocity change with respect to distance -- this is a graph that appears in Hatcher's Notebook, a commonly cited ballistics reference. Figure 4 shows how I derived an expression for this curve. I will use modern data from Berger Bullets to make my comparison. I used Berger as a data reference rather than Hatcher because the Berger web site gives me raw numbers instead of a graph (i.e. quicker to work with).

Figure 3: Derive Rate of Velocity Change with Range.

Figure 4: Derive Rate of Velocity Change with Range.

Graph of Results

Figure 5 shows how I setup my graph.

Figure 4: Graph Setup.

Figure 5: Graph Setup.

Figure 6 shows a comparison of Pejsa's projectile formula (blue line) with the Berger web simulator (orange line).  As Pejsa states, his  formula provides good accuracy until the projectile velocity approaches 1400 feet per second, which occurs at a range of 1858 feet. Figure 6 also compares the rate of change of velocity with respect to distance and the data from Hatcher's Notebook for a similar projectile. Again, the results are similar until the projectile velocity nears 1400 feet per second.

Figure 6: Graph of Empirical and Theoretical Results.

Figure 6: Graph of Empirical and Theoretical Results.

Conclusion

As Pejsa states, the agreement of the velocity versus distance is pretty good for velocities above 1400 ft/s.

Appendix A: Hatcher's Deceleration per Foot Graph.

Figure 7 shows the projectile rate of deceleration per foot of travel from Hatcher's Notebook.

Figure M: Deceleration Graph from Hatcher's Notebook.

Figure 7: Deceleration Graph from Hatcher's Notebook.

Posted in Ballistics | 4 Comments

Image of a Submarine At Periscope Depth

If you have ever wondered what a submarine looks like at periscope depth, here is a photo of the USS Key West (SSN-722). Source is the Wikipedia.
800px-Periscope_Depth

Posted in Naval History, Personal | Comments Off on Image of a Submarine At Periscope Depth

My Favorite Animation Video

I love animation and I just stumbled upon an excerpt from a television show that I saw as a boy -- "An Adventure in Art." I found this video fascinating. As an added treat, one of the artists featured is Josua Meador, who drew the famous "id monster" in the movie Forbidden Planet.

Posted in Personal | Comments Off on My Favorite Animation Video

Physical Interpretation of a Model Parameter

Introduction

I frequently get very specific questions on my posts. Normally, I simply reply directly to the question. One recent question required an answer that I thought might be interesting to a broader audience.

Background

Here is the question that I received on this post. This post contains my review of work by Pejsa that presents simple algebraic expressions for projectiles experiencing aerodynamic drag.

Has anyone provided a physical explanation for Pejsa’s “retardation coefficient”? I suspect I know what it actually represents, but I’m not sure.

I frequently need to include parameters in my system models, and I frequently end up staring at these parameters and asking "what do they represent physically?" This post will show the thought process that I go through to provide some physical meaning to these numbers.

Analysis

Pejsa derived the following expression for how a projectile's velocity varies with range (Equation 1).

Eq. 1 \displaystyle V={{V}_{0}}\cdot {{\left( 1-\frac{n\cdot r}{{{F}_{0}}} \right)}^{\frac{1}{n}}}

where

  • r is the projectile's range.
  • V is the projectile's velocity at range r
  • F0 is the retardation coefficient at the time of projectile launch.
  • n is a modeling parameter that is function of the velocity of the projectile.
  • V0 is the projectile's initial velocity.

The reader's question is focused on interpreting the meaning of F0. Figure 1 shows my derivation of a simple expression that shows me that F0 is analogous to the time constant of an RC circuit. F0 represents that distance at which the projectile's velocity has dropped to 1/e of its initial value.

Figure 1: Derivation of Simplified Expression for Velocity as a Function of Distance.

Figure 1: Derivation of Simplified Expression for Velocity as a Function of Distance.


Pejsa used a slightly different approach to interpreting F0, which I show in Figure 2.
Figure 2: Derivation of Simplified Expression for Velocity as a Function of Distance.

Figure 2: Derivation of Simplified Expression for Velocity as a Function of Distance.


Here is a quote from Pejsa's "Modern Practical Ballistics" that describes his interpretation.

As an example, for a bullet to have a retardation coefficient F equal to 2700 [feet] means that for 27 feet (1 percent of 2700), the bullet loses 1 percent (or retains 99 percent) of its remaining speed to air drag. It can be said that that the speed of the bullet "decays exponentially" at a rate of 1 percent for every 27 feet.

This statement is completely consistent with what I derived in Figure 1. In fact, a completely analogous statement can be made for RC circuits.

Conclusion

This is just a quick post to help a reader develop some physical insight into the meaning of a number. Engineers are always looking for insight into numbers. I am reminded of my favorite quote on computing and insight by Richard Hamming.

The purpose of computing is insight not numbers.

For me, I do not really understand a concept until I can describe how it behaves without having to resort to mathematics. A physical interpretation of the modeling parameters helps with developing intuition.

Posted in Ballistics, General Mathematics | 7 Comments

Measuring the Distance to the Moon and Photon Counting

Introduction

While looking up some information on the Moon, I ran into an interesting set of web pages that describes an experiment to measure the distance to the Moon with centimeter-level accuracy. This experiment sends a stream of laser pulses and determines the delay between when the pulses were sent and when a tiny fraction of them return to Earth. The project is called APOLLO, which stands for Apache Point Observatory Lunar Laser-ranging Operation.

On one of their pages, I encountered the following statement:

... the APD [Avalanche Photo-Diode] array enables simultaneous measurement of multiple photons returning from the moon. Throughput estimates for APOLLO predict a mean photon return rate as high as 5 photons per pulse.

The photons are reflecting off of a retro-reflector left on the Moon by the Apollo space project. I started to become curious about the small number of photons that were being returned with each pulse. I wondered if I could understand that number. This is another Fermi-type calculation. Let's dig in ...

Background

The APOLLO folks are trying to measure the distance between the Earth and Moon VERY accurately. Here is their approach:

  • Send a stream of pulses toward one of the various reflectors left on the moon by robots or people
  • Detect the returning photons and determine the time delay between the transmission and reception of the pulses.

While this sounds simple, achieving the required level of accuracy requires a tremendous effort. They are trying to model all sorts of subtle effects, like:

My analysis will simply look at the their photon budget to see if I understand (1) how many photons are being launched, and (2) where their photons are being lost in the measurement process.

Analysis

Number of Photons Transmitted Per Pulse

Figure 1 shows my calculations for the number of photons per pulse being launched toward the Moon.

Figure 1: Number of Photons Launched Toward the Moon.

Figure 1: Number of Photons Launched Toward the Moon.

Transmit Pulse Characteristics

As I thought, an enormous number of photons are being launched toward the Moon.

Reflected Photon Count

Figure 2 shows my calculations for the number of photons per pulse that will be reflected back toward Earth. I guessed at the percentage of photons that were lost because of absorption when the transmit pulse passed out of the Earth's atmosphere.

Figure 2: Count of the Photons Reflected from The Lunar Reflector.

Figure 2: Count of the Photons Reflected from The Lunar Reflector.

Retro-Reflector Characteristics

Only a very tiny fraction of the photons reflect back toward the Earth.

Received Photon Count

Figure 3 shows my calculations for the number of photons received at the detector. I had to make some guesses here for parameters like:

  • The percentage of the photons absorbed by passing through the atmosphere again (kAT= 48%)
  • The percentage of photons lost because of imperfect sensor alignment (kA=20%)
  • The percentage of photons lost because photons get lost in the receiver (kDE= 40%)

These are all guesses. However, my experience says that they are not unreasonable.

Figure 3: Calculation of the Number of Photons Received Per Pulse Transmitted.

Figure 3: Calculation of the Number of Photons Received Per Pulse Transmitted.

Earth Spot Size Air Transmission Efficiency Five Photon Reference

Given all the losses, just a handful of photons are available for measuring the time delay.

Conclusion

Making reasonable assumptions, I got a number very close to 5 photons received per pulse. I think I understand what they are doing.

Posted in Astronomy | Comments Off on Measuring the Distance to the Moon and Photon Counting