Aiming Torpedoes from a PT Boat

Quote of the Day

A torpedo?...You don't really know what you're askin'. You see, there ain't nothin' so complicated as the inside of a torpedo. It's got gyroscopes, compressed air chambers, compensating cylinders...

— From the movie The African Queen. Charlie is answering Rose's question "Could you make a torpedo?" As an old torpedo engineer, I appreciate that answer.


Figure 1: PT Boats Launched the WW1 era Torpedo Mk 8.

Figure 1: PT Boats Launched the WW1 era Torpedo Mk 8. (Source)

I read quite a bit of World War 1 (WW1) and World War 2 (WW2) naval history. Recently, I have tried to specialize my readings to torpedo launch platforms. I have seen scant little on torpedo fire control on PT boats during WW2 (Figure 1). While doing some history-related searches on Youtube, I discovered this video (Figure 2) that does an excellent job of showing how torpedoes were launched from PT boats – start watching at 30:45 minutes.

Figure 2: Good Video Showing How PT Boats Launched Torpedoes.

It is interesting that standard torpedo tubes (i.e., launch the torpedo with a black powder charge) were replaced with a simple cradle that dropped the torpedo off of the side of the boat (Figure 3).

Figure M: Torpedo Mk 8 launched from a cradle.

Figure 3: Torpedo Mk 8 launched from a cradle. (Source)

WW2 PT boats generally carried four torpedoes when configured for anti-ship duty. A single torpedo sight was used to aim all four torpedoes. The torpedoes were launched when the PT boat had been steered in the direction you wanted the torpedoes to go. Attacks were normally made with multiple torpedoes that were launched with their gyro angles set to provide a slight spread off of the ship's course to help compensate for any errors and to provide a higher probability of a hit. Figure 4 shows how the torpedo gyro angles are used provide the required spread.

Figure 1: Diagram of the Torpedo Spread from the PT Boat.

Figure 4: Diagram of the Torpedo Spread from the PT Boat. (Source)

There are some excellent documents on how the torpedo fire control problem was solved using mechanical calculators. These mechanical calculators are very similar to those I discussed in this post on torpedo fire control during WW1.

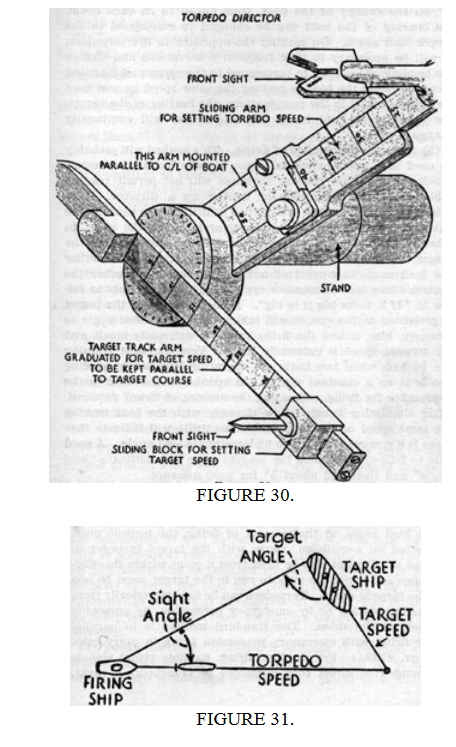
Figure 5 shows a typical torpedo director, which I think of as an analog trigonometry calculator.

Figure 2: Graphic of the PT Boat Calculator.

Figure 5:  Graphics of the PT Boat Calculator. (Source)

The stationary arm of the director is mounted parallel to the centerline of the PT boat. The stationary arm is toward the top of Figure 5.

Figure 6 shows a photograph of a Torpedo Director Mark 31 for a PT boat.

Figure 5: Mark 31 Torpedo Director. This director was designed for use with the Torpedo Mk 8.

Figure 6: Mark 31 Torpedo Director. This director is was designed for use with the Torpedo Mk 8. (Source)

Figure 7 shows the Torpedo Director Mark 31 on a PC boat.

Figure 6: Torpedo Director Mark 31 mounted on a PT boat.

Figure 7: Torpedo Director Mark 31 (upper right-hand side of photo) mounted on a PT boat. (Source)

In theory, a PT boat could accurately fire its torpedoes without a director by using the following procedure:

  • set the PT boat speed equal to the torpedo speed.
  • adjust the course of the PT boat so that the target maintains a constant bearing.
  • launch when the target is within the operating range of the torpedoes; the closer the better.
  • Steer away from the torpedo immediately after launch.

I read this procedure within a PT board document, but I do not recall where.

Posted in Ballistics, History of Science and Technology, Military History, Naval History | 25 Comments

Whale Math

Introduction

A reader asked a question that I answered in a comment response, but others may be interested so I will include my response as a post. One of my most read blog posts is about the amount of vertical deviation that exists between a level line and the Earth's surface. A reader of that post asked a related question. She measures the distance to sea life from an observation point on a cliff and was wondering how to compute the difference in distance between the arc length and the horizontal distance to an object on the water. This is a nice exercise in geometry.

Background

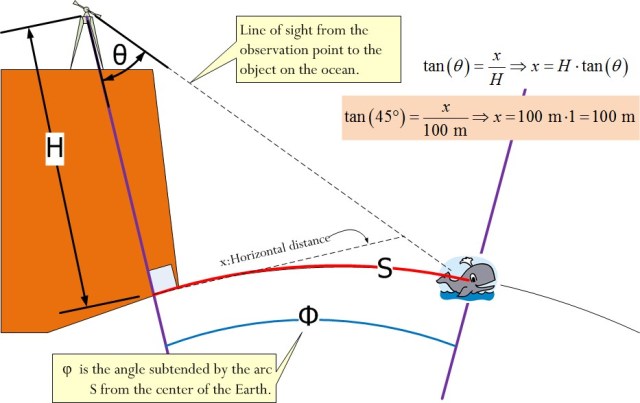
Figure 1 illustrates the measurement scenario. H represents the height of her observation site above the ocean. θ represents the angle measured by her theodolite.

Figure 1: Observation Scenario for Sea Life.

Figure 1: Observation Scenario for Sea Life.


Figure 2 illustrates the basic geometrical aspects of the problem. R represents the radius of the Earth. D represents the distance to the object.
Figure 2: Basic Geometry of the Observation Problem.

Figure 2: Basic Geometry of the Observation Problem.

Analysis

Figure 3 illustrates my analysis. The question posed wanted me to assume a cliff height H = ~100 meters and an observation angle θ = 45°.

Figure 3: Analysis of the Observation Problem.

Figure 3: Analysis of the Observation Problem.


The horizontal distance to the object is 100 meters and the arc length to the object is 100.00076 meters. This is a very small difference.

Conclusion

The amount of distance error introduced by the curvature of the Earth for short distances is very small and would be difficult to measure. However, the error could be significant for long distance measurements.

Posted in General Mathematics, General Science | 3 Comments

Balancing Leadership and Management

A major topic of discussion in management circles today is leadership. Many people struggle to draw a distinction between leadership and management. I heard another manager draw the following reasonable distinction between management and leadership. I am sure they go over similar discussions about leadership and management in line management training to boost the skills of these professional managers and leaders but today I am going to give you my definition.

Managing is about making your sure your people are doing things right. Leadership is about making sure that your people are doing the right things.

This statement tells us that management is about execution. A manager must ask questions like:

  • Do we have the right tools?
  • Do we have processes in place that ensure we meet our quality, efficiency, and schedule goals?
  • Does everyone know their role in the process?
  • Are the deliverables at each stage of the process well defined?
  • Do we have metrics in place for measuring our performance?
  • Do we have a plan for incorporating feedback into the process?

Leadership is about vision -- a leader has a larger view of the organization's objectives. The leader must ensure that the staff does not get so involved in day-to-day execution that the lose sight of the long-range objective. When it comes to how to lead, leaders must ask questions like:

  • How does what I we are doing today advance us toward our ultimate goal tomorrow?
  • Do I have a strategy for achieving our ultimate goals?
  • Do we have the right staff to execute the strategy
  • Can I foresee any obstacles and what can I do to mitigate their impact?
  • How do we attract and retain the kind of talent that we are going to need?
  • Are our processes scalable?
  • How do I effectively communicate our organizational vision?

When I think about leadership, I am always cognizant that a leader needs followers -- business is filled with people with a vision that they cannot sell to others. Having followers means that you can articulate a viable vision that other people are drawn to. It also means that you value these followers enough to make sure that their needs are cared for. When I think about the people skills that a leader requires, I think of this quote from General Shinseki.

You must love those you lead before you can be an effective leader. You can certainly command without that sense of commitment, but you cannot lead without it. And without leadership, command is a hollow experience, a vacuum often filled with mistrust and arrogance.

I also recognize that the skills of the leader are frequently at odds with being a manager. Time I spend on being managing is time I am not spending on leadership. There is an aspect of balance involved. The balance needed depends on the project and the team you have put together. Ultimately, I must spend enough time on management so that my team runs long enough and efficiently enough for our strategy to play out.

It makes sense that the balance between management and leadership must judgement and balance. I always tell my staff that the the interesting questions in life have the answer "It depends ..." -- otherwise they really wouldn't be questions.

Posted in Management | 3 Comments

Power Supply Voltage Control Using Current DAC

Introduction

In this post, I am analyzing the feedback circuit of power supply with an output voltage that is controlled using a current-output Digital-to-Analog Converter (DAC). I analyzed a related situation (voltage DAC) in this earlier post.

This exercise started when an engineer grabbed me and said he was having issues with using a current DAC to control the output voltage of power supply. He was using the device exactly has stated in the application note, but it was not producing the proper voltages. He needed to find the problem immediately because he was on a critical project and was beginning to run late. This post goes through the analysis I prepared for him. As it turns out, the datasheet from the power supply vendor had a number of errors in it. This is not unusual -- I have spent many hours trying to work my way through datasheet errors.

Using the analysis below, resistor settings were computed that had the power supply working as predicted in just a few minutes. I worked the exercise at the desk of an engineer who I am training in Mathcad. This proved to be an excellent demonstration of how a mathematical tool can speed an engineer's work.

Background

I described the operation of this type of voltage-variable power supply in my previous post, but I will list the key operational points here:

  • The power supply's control system will adjust its output voltage so that the voltage at the feedback pin (VFB) is 0.8 V.
  • In this situation, the engineer had an unused current DAC available on the Printed Circuit Board (PCB). He wanted to use this device to control the output voltage of the power supply. To understand the function of a PCB, and the various types that can be used for devices like this, people can visit mktpcb.com to gain more information.
  • VFB is the sum of the power supply's output voltage (VOut) through a voltage divider and the voltage generated by the DAC's output current fed into the center node of the voltage divider.
  • Superposition is used to determine VFB.

Nothing too sophisticated -- this analysis represents the kind of work we do everyday.

Analysis

Figure 1 shows the circuit and my analysis. I need to compute two resistor values: R0A and R0B.

Figure 1: Analysis of Current DAC for Control of a Power Supply Output Voltage.

Figure 1: Analysis of Current DAC for Control of a Power Supply Output Voltage.


These two resistor values were then substituted into the circuit and everything worked!

Conclusion

Just a quick example. The engineer grabbed me at 4:00 PM and we had a working circuit by 4:30 PM. I was home before 5:00 PM.

Posted in Electronics | 1 Comment

Fireflies and Supernova

Introduction

Scientists always face the problem of making their work accessible to the public. Accessibility is crucial to scientific research continuing to receive funding. Part of this accessibility is creating analogies that relate scientific data to aspects of everyday life. Here is an analogy that I encountered recently comparing the light from a distant supernova to that from a firefly located thousands of kilometers away.

Mingus [SN SCP-0401] was so distant and so faint — the equivalent of looking at a firefly from 3,000 miles (5,000 kilometers) away — that its true nature remained a mystery for a while, researchers said.

Here is a video that goes into more detail on supernova SCP-0401.

http://www.youtube.com/watch?v=5BpnJI3SLv0&w=560&h=315

The speaker in this video states (@time=3:34 minutes) that:

This supernova is about as bright as a firefly viewed from 3000 miles away.

Let's see if we can provide more insight into these statements about fireflies and supernovae. I will treat this as a Fermi problem -- my work will be very approximate.

Background

Optical Power of Fireflies

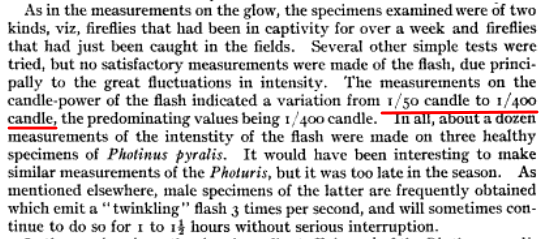
I found the following quote (Figure 2) in the book "A Physical Study of the Firefly" by Coblentz on Google Books. Access to the book is complete and free.

Figure 2: Quote on the Candlepower of a Firefly Flash.

Figure 2: Quote on the Candlepower of a Firefly Flash.

For the following analysis, I will treat the flash of a firefly as having the an optical power of 1/50th of an international candle (unit in use at the time the quote was made), which is at the top end of the range stated in the quote of "1/50 candle to 1/400 candle". I will then convert this unit to the modern candela.

Image of SN SCP-0401

Figure 1 shows an image of SN SC-0401 (Source). Notice how astronomers do not get a lot of visual information to work with.

Figure 1: Image of Supernova SC-0401.

Figure 1: Image of Supernova SC-0401.

Supernova Characteristics

Standard Candle

Very long distances in astronomy are measured using objects of known absolute magnitude, which are commonly known as standard candles. We can measure the apparent magnitude of a standard candle and calculate the distance from Earth using Equation 1. For more detail on Equation 1, see this blog post.

Eq. 1 \displaystyle 5\cdot \log \left( \frac{R}{10\text{ pc}} \right)=m-M

where

  • R is the distance of the celestial object from the observer
  • M is the absolute magnitude of the celestial object when positioned at 10 pc from the observer.
  • m is the apparent magnitude of the celestial object at a distance R from the observer.

Supernova Absolute Magnitude, Apparent Magnitude, and Distance

It turns out that supernova SN SC-0401 is a special type of supernova that is a standard candle called a Type 1A supernova. A Type 1A supernova has an absolute magnitude of -19.3 ± 0.3 (reference).

What is Brightness?

The brightness of an object is expressed in units of lux. The Wikipedia defines lux as follows.

The lux (symbol: lx) is the SI unit of illuminance and luminous emittance, measuring luminous flux per unit area. It is equal to one lumen per square metre. In photometry, this is used as a measure of the intensity, as perceived by the human eye, of light that hits or passes through a surface. It is analogous to the radiometric unit watts per square metre, but with the power at each wavelength weighted according to the luminosity function, a standardized model of human visual brightness perception.

We need to make some observations about this definition:

  • The lux is the power density of the light impacting a given area weighted by the eye's spectral sensitivity to wavelengths present in that light.
  • The spectral sensitivity of the eye varies greatly with wavelength, for example, the eye's sensitivity to light at 490 nm amounts to 20% of its sensitivity at 555 nm (Source).
  • The spectral sensitivity of the eye is greatest for light at 555 nm (i.e. green)

For light from the Sun, we can relate the lux level to the received visible light power using a few facts:

  • Direct sunlight has a maximum lux level of 120,000 (Source)
  • Direct sunlight has a power level of 378 W/m² in the visible wavelength range (Source)
  • Light power is normalized to its equivalent 555 nm power for use in visual calculations. The equivalent 555 nm optical power is 142.6 W/m² (Source).

Analysis

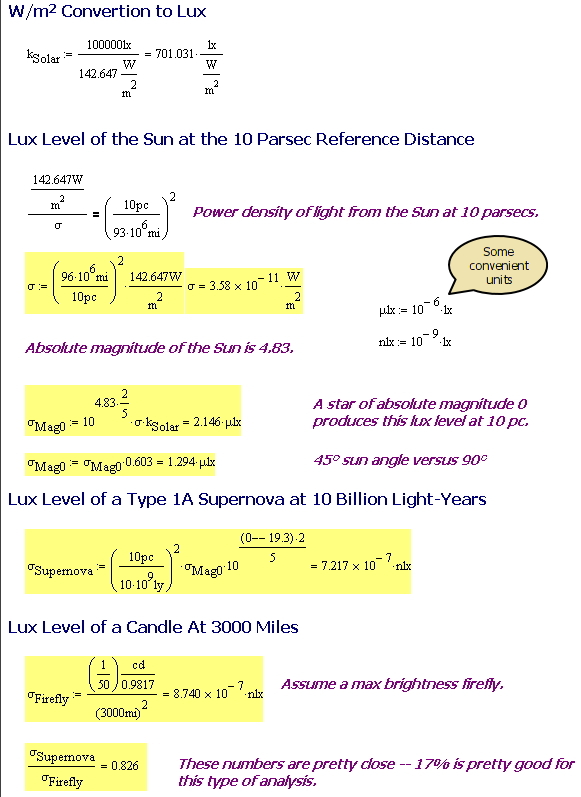
Figure 3 shows my analysis that compares the light from a type 1A supernova to a candle at 3000 miles. Several things are worth noting about this analysis.

  • I computed the light level (in lux) from a magnitude 0 star as ~2.1 μlux

    It turns out this number is very close to the 2.09 μlux reported on this web site. This light level is from a magnitude 0 star that is at the zenith.

  • I assumed that supernova is at 45% angle to the horizon.

    This is the latitude that I live at. I estimated the attenuation of the atmosphere using Appendix A from this blog post.

  • I assumed the Sun and and a Type 1A supernova have similar spectral distribution

    Admittedly, this is a big stretch, but I am just working approximately. The approximation comes in when come up with a conversion factor between W/m² of visible light power and lux level.

My very approximate result shows that a Type 1A supernova at 10 billion light-years away and a firefly at maximum light intensity and 3000 miles range do have about the same light level.

Figure 3: Analysis of Type 1A Supernova and a Candle at 3000 miles.

Figure 3: Analysis of Type 1A Supernova and a Candle at 3000 miles.

Conclusion

I was able to show that the brightness of SN SCP-0401 is about the same as a firefly at 3000 miles. That does seem pretty dim!

Posted in Astronomy, General Science | Comments Off on Fireflies and Supernova

Too Many Definitions of Candle

I have been doing some reading about photometry lately and I noticed that the unit of lighting called the candle has had quite a history. I used to work for a metrology company and I have always been interested in how standards and units are established. The candle has had a more volatile history than I am used to seeing. I thought I would document some of the history here to see how much the unit has changed over time. In fact, the candle has now been replaced in most situations by the candela. However, you still see flashlights rated in "candlepower".

Table 1 summarizes a few of the early versions of the candle that ran into while doing a bit of googling. I became curious about the candle when I saw a number of forum chats that were struggling with determining the proper conversion factors for the different types of candles. As I looked into the matter, it seemed the early experimenters had trouble with these units as well.

Table 1: Definitions of Candle that I Encountered During a Google Search
Unit Name Definition Definition Source
Candela (1948) The candela is the luminous intensity, in a given direction, of a source that emits monochromatic radiation of frequency 540E12 hertz (555 nm wavelength in a vacuum) and that has a radiant intensity in that direction of 1⁄683 watt per steradian. Candela
New Candle (1946) The luminous intensity of a square centimeter of a blackbody radiator at the temperature at which molten platinum solidifies as 60 new candles. New Candle
International Candle (1909) The International Candle was replaced by the New Candle. The International Candle is equivalent to 58.9 international candles. International Candle
US Candle (Date Unknown)Spermaceti candle burning 120 grains per hour. Weights, Measures Dict.
British Candle (1860) A spermaceti candle of 1/6 lb at 2 grains per minute. Electrical Age
Weights, Measures Dict.
Carcel candle (before 1882) A standard Carcel lamp burning colza oil at the standard rate and producing a standard flame. Carcel candle

Decimal Candle (1889) Candle that burns 8.5 grams of wax per hour. It put out the one-tenth the light of a Carcel candle, which I have found little information on. Decimal Candle
Hefner Candle (1884 -- Germany) Burns amyl acetate. Flame height of 40 mm, with a very specifically defined wick. Hefner Candle

Figure 1 shows some unit conversions that I put together. Note that these are not solid conversions. The early candles were very poorly defined and the early experimenters appear to have had a difficult time coming up with a consistently reproducible standard.

Figure 1: Summary of Candle Unit Conversions.

Figure 1: Summary of Candle Unit Conversions.

I am including a link to a web page that has a good set of luminosity conversions.

Posted in General Science, History of Science and Technology | 2 Comments

Atmospheric Filtering of Sunlight

Introduction

Today, I was asked a question about the amount of visible optical power that actually reaches the Earth's surface. I also need to compute the illuminance of this optical power, which tells me how bright this light appears.

The word visible is the interesting part of the question because it involves the human eye. In optical engineering we often break problems into one of two types, radiometric or photometric. Radiometric problems simply treat light as a form of energy and we do not care whether it can be seen or not. I normally work in the radiometric area -- the only light on my fiber is infrared. The photometric area involves the human eye and what can be seen. This area of optical engineering goes way back to the time of candles. Ever heard of candle-power? Photometry is quite different from radiometry and even has its own units.

I thought this was an interesting question that would also allow me to demonstrate a common application of integral calculus. Just a quick problem, but it does answer a question that came up. While I need only approximate results, but the method I use can easily be made more accurate. I only have a short period of time to come up with an answer.

The most difficult part of this area of optics is understanding the terms associated with lighting as perceived by the human eye, so I will spend a bit of time on the definitions. I have chosen to use the same symbology as the Wikipedia and I make liberal use of links to that wonderful source of information.

Background

I am going to base my definitions on those from the Wikipedia. I will add some commentary that will hopefully help explain the terms a bit better.

Definitions

candela (symbol:cd)
The candela is the luminous intensity, in a given direction, of a source that emits monochromatic radiation of wavelength 555 nm and that has a radiant intensity in that direction of 1?683 W per steradian. The odd factor of 1/683 was chosen to make the candela close in value to the original unit called the candle.
luminous flux
The luminous flux is the total radiated power factored by the sensitivity of the human eye. The eye's sensitivity is different for different wavelength. The lumen unit computes the human eye-equivalent 555 nm light level. Measuring light levels in units of lumen is useful for comparing the eye-perceived light level of different light sources. Two lights generators with the same lumen output will produce the same level of lighting as far as the human eye is concerned.

lumen (symbol:lm)
The lumen is a unit that describes luminous flux emitted into a unit solid angle (1 steradian [sr]) by an isotropic point source having a luminous intensity of 1 candela.
lux (symbol:lx)
The lux is a unit of illuminance that measures the luminous flux per unit area. The lux level from the at object determines its brightness. Photographer's light meters measure light level in terms of lux (they may display in other units, but they measure lux).
luminosity function
The luminosity function or luminous efficiency function describes the average spectral sensitivity of human visual perception of brightness as a function of wavelength. For example, the human eye is much more sensitive to green light than it is to red light. This means that for a red light to have the same brightness to the human eye as green light, the red light must be at a much higher radiated power level. I think of luminous flux as measuring the an amount of light relative to an amount of 555 nm light with the same human eye response.
illuminance
Illuminance is the luminous flux incident per unit area on a surface. It is measured in units of lux [lumens/m²].
solar constant
The amount of solar radiation that reaches the Earth. The value is usually assumed to be ~1.361 kW/m², however, the solar "constant" is not really constant because the distance between the Earth and Sun varies throughout the year. Anyone wanting to accurately measure this radiation can measure the radiation for themselves by using on of these weather stations. Getting an accurate reading of the radiation can greatly effect the results of this investigation. Solar activity also varies slightly during the Sun's 11 year cycle.
solar irradiance spectrum
The electromagnetic power emitted from the Sun as a function of wavelength.

Luminous Flux Calculation

I want to calculate the maximum luminous flux per m² at the Earth's surface. Evaluating Equation 1 will give me what I want (modified from this source).

Eq. 1 \displaystyle E_e=\underbrace{683.002\ \text{lm/W}}_{\text{Converts 555 nm power density to lux}}\cdot \underbrace{\int\limits_{0}^{\infty }{{\bar{y}}}(\lambda )E_{e\lambda}(\lambda )d\lambda }_{\text{Equivalent 555 nm power density}}

where

  • Ee is the luminous flux per unit area [lx = lm/m²]
  • \overline{y}(\lambda) is the standard luminosity function [dimensionless]
  • E_{e\lambda}(\lambda) is the spectral power distribution of the radiation [W/m²/nm]
  • ? is wavelength [nm]

Solar Irradiance Spectrum

The Wikipedia has a great article on sunlight that provides an excellent graphic that illustrates the optical power spectrum of the Sun in space and at sea level (Figure 1). Figure 1 is describe by the function E_{e\lambda}(\lambda) described as part of Equation 1.

Figure 1: Optical Power Spectrum of the Sun in Space and at Sea Level.

Figure 1: Optical Power Spectrum of the Sun in Space and at Sea Level.


I will be digitizing this graph for analysis purposes. Because I only need an approximate result, I will not be worried about doing an extremely accurate job. Accurately digitizing a jagged spectrum like we see in Figure 2 is time consuming.

Luminosity Function

The Wikipedia also has a graphic that illustrates the sensitivity of the optical eye relative to its sensitivity at 550 nm, which is the wavelength of maximum sensitivity. I will use the function described by the dark solid black line (CIE 1931 standard). I chose that function just because it is still commonly used for describing the eye's sensitivity under well-lit conditions. It will work fine for my approximate analysis here. I will use Figure 2 for my \overline{y}(\lambda), described as part of Equation 1.

Figure 2: Photopic (black) and scotopic (green) luminosity functions.[c 1] The photopic includes the CIE 1931 standard[c 2] (solid), the Judd–Vos 1978 modified data[c 3] (dashed), and the Sharpe, Stockman, Jagla & Jägle 2005 data[c 4] (dotted). The horizontal axis is wavelength in nm.

Figure 2: Photopic (black) and scotopic (green) luminosity functions.[c 1] The photopic includes the CIE 1931 standard[c 2] (solid), the Judd–Vos 1978 modified data[c 3] (dashed), and the Sharpe, Stockman, Jagla & Jägle 2005 data[c 4] (dotted). The horizontal axis is wavelength in nm.

Analysis

Figure 3 shows my analysis. The basic approach is simple, but appeared to work.

  • Digitize Figures 1 and 2 (I use Dagra)
  • Use a spline interpolation to create continuous versions of these functions.
  • Generate the product of the solar irradiance and the eye's luminosity functions.
  • Integrate the product of the two functions (Mathcad).
Figure 3: Mathcad Analysis of the Illuminance of Sunlight After Passing Through the Atmosphere.

Figure 3: Mathcad Analysis of the Illuminance of Sunlight After Passing Through the Atmosphere.

My analysis shows that Figure 1 represents a 100K lux light level at sea level. While the solar constant is about 1350 W/m² for light in space, only about 1000 W/m² actually gets through the atmosphere (Wikipedia states 1004 W/m²). Of this amount, only about 378 W/m² gets through in the form of visible light. Of the visible light, the eye perceives it as having the same brightness 143 W/m² of 555 nm light. Since I was working assuming that the Sun is directly overhead (90° solar angle), this is as bright as things get because the light has the least atmosphere to pass through. Appendix A shows how the maximum light level drops with solar angle.

Conclusion

My answer of 146 W/m² agrees reasonably close with the answer 170 W/m² given by the "Handbook of Optical Metrology: Principles and Application" by Yoshizawa (ISBN 1420019511), and a snippet from this reference is included in Appendix B. So I think I understand how this number is determined.

Appendix A: Dynamic Range of Sunlight on Earth As a Function of Solar Angle

.
Figure 4 is a log plot of some data I found on this web page. I was surprised at how quickly the brightness level drops as the solar angle decreases.

Figure 4: Sunlight Level (Lux) As a Function of Solar Angle.

Figure 4: Sunlight Level (Lux) As a Function of Solar Angle.

Appendix B: Text Quotation on the Solar Irradiance at the Earth's Surface

Figure 5 is an excerpt from the "Handbook of Optical Metrology: Principles and Application" by Yoshizawa (ISBN 1420019511) that states his estimate for the luminous power at sea level on the Earth.

Figure 5: Quotation on the Solar Irradiance at the Earth's Sur

Figure 5: Quotation on the Solar Irradiance at the Earth's Surface.

Posted in Astronomy, General Science | 1 Comment

A Tale of Modern Life

I have mentioned that I manage an engineering team that has multiple projects going on at any one time. I have a project going on in China at this moment that involves two engineers. One of the engineers told me last night that he is going to get married in two weeks. As you would expect, he is both excited and nervous. I was able to get to know him well because he spent some time with my group in the US last year. I even took him shopping a couple of times. Those experiences were interesting.

His favorite places to shop were the various malls that ring the Minneapolis area. His favorite mall is called the Albertville Mall. When he would shop, he would use his phone to get shopping advice from his fiance, who was working in Germany at the time. I was amazed at how well those two could shop together, even though they were separated by six time zones. My wife and I are not that efficient standing right next to each other -- of course, I do not behave well while shopping. That is one thing both my wife and mother agree on 🙂

This engineer preferred to shop in the US because the prices and quality of the goods here are better than what he could buy at home in China. The interesting thing about that statement is that most of the goods he was buying were actually made in China. It may seem strange, but he assured me that this was the case.

Posted in Personal | Tagged | Comments Off on A Tale of Modern Life

Star Visual Magnitude Math

Introduction

I have been reading a number of interesting astronomy articles lately. These articles often refer to the apparent and absolute magnitude of a celestial object or event (example). I thought I would work through a bit of the math associated with these terms.

Background

History

Like most tales in science, the story of measuring the visual magnitudes of celestial objects dates back to the ancient Greeks. Most sources say that Hipparchus was the first to develop a system for ranking the brightness of celestial object by their visual magnitudes. He said that the brightest objects were of the "first magnitude" and he ranked less bright objects on a scale from second to sixth magnitude, with sixth magnitude being at the limit of human visibility. This system is the basis for the more formal magnitude system that astronomers use today. I have a number of astronomy-oriented posts planned and I will be using this information in the posts to follow.

Definitions

The Wikipedia gives the following definitions for apparent and absolute magnitude:

apparent magnitude
The apparent magnitude (m) of a celestial body is a measure of its brightness as seen by an observer on Earth, adjusted to the value it would have in the absence of the atmosphere. The brighter the object appears, the lower the value of its magnitude.
absolute magnitude
Absolute magnitude (M) is the measure of a celestial object's intrinsic brightness. It is the apparent magnitude an object would have if it were at a standard luminosity distance (10 parsecs [pc]) away from the observer, in the absence of astronomical extinction. It allows the true brightnesses of objects to be compared without regard to distance.

Analysis

Mathematical Definition

Norman Robert Pogson provided a quantitative framework for the Greek's qualitative approach. He defined a typical first magnitude star as being 100 times brighter as a typical sixth magnitude star. In general, an object with apparent magnitude value less than another object by five will be 100 times brighter. Equation 1 describes this relationship.

Eq. 1 \displaystyle \frac{{{L}_{1}}}{{{L}_{2}}}={{100}^{\frac{{{m}_{2}}-{{m}_{1}}}{5}}}={{10}^{\frac{{{m}_{2}}-{{m}_{1}}}{5}\cdot 2}}

where

  • L1 is the luminance of object 1.
  • L2 is the luminance of object 2.
  • m1 is the apparent magnitude of object 1
  • m2 is the apparent magnitude of object 2.

This formula is similar to those listed here.

Magnitude Variation with Range

The Wikipedia states that the apparent magnitude, absolute magnitudes, and range are related by Equation 2.

Eq. 2 \displaystyle 5\cdot \log \left( \frac{R}{10\text{ pc}} \right)=m-M

where

  • R is the distance of the celestial object from the observer
  • M is the absolute magnitude of the celestial object when positioned at 10 pc from the observer.
  • m is the apparent magnitude of the celestial object at a distance R from the observer.

Figure 1 shows my derivation of this result. The inverse square law figures prominently in this derivation.

Figure 1: Apparent Magnitude as a Function of Range and Absolute Magnitude.

Figure 1: Apparent Magnitude as a Function of Range and Absolute Magnitude.

Examples

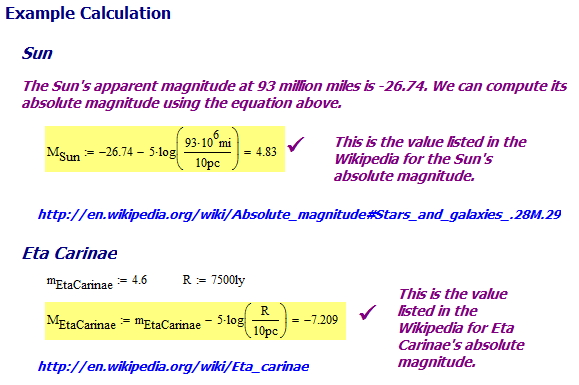
Figure 2 shows a couple of examples of computing absolute magnitude given apparent magnitude and range. I was able to obtain the same absolute magnitudes as listed in the Wikipedia for the Sun and Eta Carinae.

Figure 2: Two Examples of Magnitude Calculations.

Figure 2: Two Examples of Magnitude Calculations.

Conclusion

I wanted to review the basics of brightness (aka luminance) and magnitude. This is a nice warm-up exercise for some other astronomy posts that I have planned.

Posted in Astronomy, General Science | 1 Comment

Tornado Frequency Math

Introduction

I was watching Global Public Square on CNN when they presented a trivia question that seemed interesting.

Which nation has the most tornadoes relative to its land area? (a) Britain, (b) Bangladesh, (C) Belgium, (D) United States.

The answer given was (a) Britain. A quick search on the Internet did show a news article Britain having the "highest rate of tornadoes" in the world. The Wikipedia also states that Britain "probably" has the most tornadoes per unit area per year, but it does mention the Netherlands in the same paragraph.

Since I live just north of the top end of "Tornado Alley", I thought I would investigate a bit and see what level of tornado activity that Britain has. While I am at it, I will also look at some other European nations. I do need to comment that while Europe does have quite few tornadoes, they generally are small compared to those in the US. A small tornado is a completely different experience from a large one. I personally have had an EF3 come toward me and pull back into the clouds at the last minute. The sight and sound of a large tornado is something you never forget.

Analysis

Tornado Activity in the US

Since I live in the US, I want to compare international tornado activity to activity in the US. The Weather Channel put together a very nice article on the top 10 states with respect to the number of tornadoes per 10K square miles (mi2). I have put this data into tabular form in Table 1. I have also done the unit conversion from mi2 to square kilometers (km2) to facilitate comparison with European data.

Table 1: Top Ten States for Tornadoes Per 10K Square Miles/Kilometers
State Name Tornadoes per 10K mi2 Tornadoes per 10K km2
Florida 12.3 4.7
Kansas 11.7 4.5
Maryland 9.9 3.8
Illinois 9.6 3.7
Mississippi 9.2 3.6
Iowa 9.2 3.6
Oklahoma 9.0 3.5
South Carolina 8.9 3.4
Alabama 8.6 3.3
Louisiana 8.5 3.3

Tornado Activity in Europe

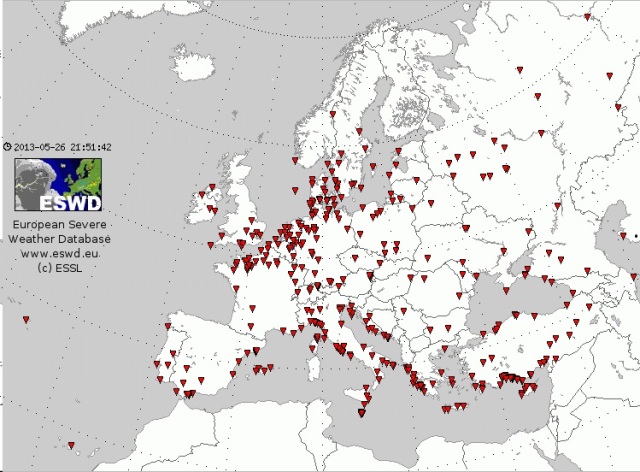
I first went out to the European Severe Weather Database and looked at the reports of tornado activity for 2012. Figure 1 is a graphic of their data -- there were quite a few reports (377 on this image).

Figure 1: Tornado Reports from the ESWD for 2012.

Figure 1: Tornado Reports from the ESWD for 2012.


Table 2 is a summary of European annual tornado frequency data from this web site. I have added columns for the area of the countries and my calculation for the frequency of tornadoes per square km per year.

Table 2: Top Ten European Countries for Tornadoes Per 10K Square Miles/Kilometers Per Year
Country Tornado Count Range Average Tornado Count Area (km2) Tornadoes per km2 per year
Netherlands 20-25 22.5 41850 5.38
Belgium 5-10 7.50 30528 2.46
United Kingdom 50 50.00 242900 2.06
Estonia 8-10 9.00 45227 1.99
Ireland 10-11 10.50 70273 1.49
Czech Republic 10 10.00 78865 1.27
United States 1200 1200.00 9629091 1.25
Hungary 10-13 11.50 93028 1.24
Germany 30 30.00 357114 0.84
Greece 8-10 9.00 131990 0.68
Spain 30 30.00 505992 0.59
Italy 12-18 15.00 301336 0.50
France 10-30 20.00 640679 0.31
Finland 10 10.00 338424 0.30
European Russia 8-10 9.00 3960000 0.02

Conclusion

I do see that Britain has a higher rate of tornadoes per unit area per year than the US. While Britain does have the most tornadoes per year in Europe, its rate per unit area is not the highest in Europe (at least for the data I found). The relatively low tornado rate per unit area per year of the US makes sense now that I think about it because most of the US only rarely sees tornadoes. Since the US is a big country, the average rate is low. Our Midwestern states do have high tornado rates. However, the Netherlands still beats them all.

Posted in General Science | 2 Comments