Atmospheric Filtering of Sunlight

Introduction

Today, I was asked a question about the amount of visible optical power that actually reaches the Earth's surface. I also need to compute the illuminance of this optical power, which tells me how bright this light appears.

The word visible is the interesting part of the question because it involves the human eye. In optical engineering we often break problems into one of two types, radiometric or photometric. Radiometric problems simply treat light as a form of energy and we do not care whether it can be seen or not. I normally work in the radiometric area -- the only light on my fiber is infrared. The photometric area involves the human eye and what can be seen. This area of optical engineering goes way back to the time of candles. Ever heard of candle-power? Photometry is quite different from radiometry and even has its own units.

I thought this was an interesting question that would also allow me to demonstrate a common application of integral calculus. Just a quick problem, but it does answer a question that came up. While I need only approximate results, but the method I use can easily be made more accurate. I only have a short period of time to come up with an answer.

The most difficult part of this area of optics is understanding the terms associated with lighting as perceived by the human eye, so I will spend a bit of time on the definitions. I have chosen to use the same symbology as the Wikipedia and I make liberal use of links to that wonderful source of information.

Background

I am going to base my definitions on those from the Wikipedia. I will add some commentary that will hopefully help explain the terms a bit better.

Definitions

candela (symbol:cd)
The candela is the luminous intensity, in a given direction, of a source that emits monochromatic radiation of wavelength 555 nm and that has a radiant intensity in that direction of 1?683 W per steradian. The odd factor of 1/683 was chosen to make the candela close in value to the original unit called the candle.
luminous flux
The luminous flux is the total radiated power factored by the sensitivity of the human eye. The eye's sensitivity is different for different wavelength. The lumen unit computes the human eye-equivalent 555 nm light level. Measuring light levels in units of lumen is useful for comparing the eye-perceived light level of different light sources. Two lights generators with the same lumen output will produce the same level of lighting as far as the human eye is concerned.

lumen (symbol:lm)
The lumen is a unit that describes luminous flux emitted into a unit solid angle (1 steradian [sr]) by an isotropic point source having a luminous intensity of 1 candela.
lux (symbol:lx)
The lux is a unit of illuminance that measures the luminous flux per unit area. The lux level from the at object determines its brightness. Photographer's light meters measure light level in terms of lux (they may display in other units, but they measure lux).
luminosity function
The luminosity function or luminous efficiency function describes the average spectral sensitivity of human visual perception of brightness as a function of wavelength. For example, the human eye is much more sensitive to green light than it is to red light. This means that for a red light to have the same brightness to the human eye as green light, the red light must be at a much higher radiated power level. I think of luminous flux as measuring the an amount of light relative to an amount of 555 nm light with the same human eye response.
illuminance
Illuminance is the luminous flux incident per unit area on a surface. It is measured in units of lux [lumens/m²].
solar constant
The amount of solar radiation that reaches the Earth. The value is usually assumed to be ~1.361 kW/m², however, the solar "constant" is not really constant because the distance between the Earth and Sun varies throughout the year. Anyone wanting to accurately measure this radiation can measure the radiation for themselves by using on of these weather stations. Getting an accurate reading of the radiation can greatly effect the results of this investigation. Solar activity also varies slightly during the Sun's 11 year cycle.
solar irradiance spectrum
The electromagnetic power emitted from the Sun as a function of wavelength.

Luminous Flux Calculation

I want to calculate the maximum luminous flux per m² at the Earth's surface. Evaluating Equation 1 will give me what I want (modified from this source).

Eq. 1 \displaystyle E_e=\underbrace{683.002\ \text{lm/W}}_{\text{Converts 555 nm power density to lux}}\cdot \underbrace{\int\limits_{0}^{\infty }{{\bar{y}}}(\lambda )E_{e\lambda}(\lambda )d\lambda }_{\text{Equivalent 555 nm power density}}

where

  • Ee is the luminous flux per unit area [lx = lm/m²]
  • \overline{y}(\lambda) is the standard luminosity function [dimensionless]
  • E_{e\lambda}(\lambda) is the spectral power distribution of the radiation [W/m²/nm]
  • ? is wavelength [nm]

Solar Irradiance Spectrum

The Wikipedia has a great article on sunlight that provides an excellent graphic that illustrates the optical power spectrum of the Sun in space and at sea level (Figure 1). Figure 1 is describe by the function E_{e\lambda}(\lambda) described as part of Equation 1.

Figure 1: Optical Power Spectrum of the Sun in Space and at Sea Level.

Figure 1: Optical Power Spectrum of the Sun in Space and at Sea Level.


I will be digitizing this graph for analysis purposes. Because I only need an approximate result, I will not be worried about doing an extremely accurate job. Accurately digitizing a jagged spectrum like we see in Figure 2 is time consuming.

Luminosity Function

The Wikipedia also has a graphic that illustrates the sensitivity of the optical eye relative to its sensitivity at 550 nm, which is the wavelength of maximum sensitivity. I will use the function described by the dark solid black line (CIE 1931 standard). I chose that function just because it is still commonly used for describing the eye's sensitivity under well-lit conditions. It will work fine for my approximate analysis here. I will use Figure 2 for my \overline{y}(\lambda), described as part of Equation 1.

Figure 2: Photopic (black) and scotopic (green) luminosity functions.[c 1] The photopic includes the CIE 1931 standard[c 2] (solid), the Judd–Vos 1978 modified data[c 3] (dashed), and the Sharpe, Stockman, Jagla & Jägle 2005 data[c 4] (dotted). The horizontal axis is wavelength in nm.

Figure 2: Photopic (black) and scotopic (green) luminosity functions.[c 1] The photopic includes the CIE 1931 standard[c 2] (solid), the Judd–Vos 1978 modified data[c 3] (dashed), and the Sharpe, Stockman, Jagla & Jägle 2005 data[c 4] (dotted). The horizontal axis is wavelength in nm.

Analysis

Figure 3 shows my analysis. The basic approach is simple, but appeared to work.

  • Digitize Figures 1 and 2 (I use Dagra)
  • Use a spline interpolation to create continuous versions of these functions.
  • Generate the product of the solar irradiance and the eye's luminosity functions.
  • Integrate the product of the two functions (Mathcad).
Figure 3: Mathcad Analysis of the Illuminance of Sunlight After Passing Through the Atmosphere.

Figure 3: Mathcad Analysis of the Illuminance of Sunlight After Passing Through the Atmosphere.

My analysis shows that Figure 1 represents a 100K lux light level at sea level. While the solar constant is about 1350 W/m² for light in space, only about 1000 W/m² actually gets through the atmosphere (Wikipedia states 1004 W/m²). Of this amount, only about 378 W/m² gets through in the form of visible light. Of the visible light, the eye perceives it as having the same brightness 143 W/m² of 555 nm light. Since I was working assuming that the Sun is directly overhead (90° solar angle), this is as bright as things get because the light has the least atmosphere to pass through. Appendix A shows how the maximum light level drops with solar angle.

Conclusion

My answer of 146 W/m² agrees reasonably close with the answer 170 W/m² given by the "Handbook of Optical Metrology: Principles and Application" by Yoshizawa (ISBN 1420019511), and a snippet from this reference is included in Appendix B. So I think I understand how this number is determined.

Appendix A: Dynamic Range of Sunlight on Earth As a Function of Solar Angle

.
Figure 4 is a log plot of some data I found on this web page. I was surprised at how quickly the brightness level drops as the solar angle decreases.

Figure 4: Sunlight Level (Lux) As a Function of Solar Angle.

Figure 4: Sunlight Level (Lux) As a Function of Solar Angle.

Appendix B: Text Quotation on the Solar Irradiance at the Earth's Surface

Figure 5 is an excerpt from the "Handbook of Optical Metrology: Principles and Application" by Yoshizawa (ISBN 1420019511) that states his estimate for the luminous power at sea level on the Earth.

Figure 5: Quotation on the Solar Irradiance at the Earth's Sur

Figure 5: Quotation on the Solar Irradiance at the Earth's Surface.

Posted in Astronomy, General Science | 1 Comment

A Tale of Modern Life

I have mentioned that I manage an engineering team that has multiple projects going on at any one time. I have a project going on in China at this moment that involves two engineers. One of the engineers told me last night that he is going to get married in two weeks. As you would expect, he is both excited and nervous. I was able to get to know him well because he spent some time with my group in the US last year. I even took him shopping a couple of times. Those experiences were interesting.

His favorite places to shop were the various malls that ring the Minneapolis area. His favorite mall is called the Albertville Mall. When he would shop, he would use his phone to get shopping advice from his fiance, who was working in Germany at the time. I was amazed at how well those two could shop together, even though they were separated by six time zones. My wife and I are not that efficient standing right next to each other -- of course, I do not behave well while shopping. That is one thing both my wife and mother agree on 🙂

This engineer preferred to shop in the US because the prices and quality of the goods here are better than what he could buy at home in China. The interesting thing about that statement is that most of the goods he was buying were actually made in China. It may seem strange, but he assured me that this was the case.

Posted in Personal | Tagged | Comments Off on A Tale of Modern Life

Star Visual Magnitude Math

Introduction

I have been reading a number of interesting astronomy articles lately. These articles often refer to the apparent and absolute magnitude of a celestial object or event (example). I thought I would work through a bit of the math associated with these terms.

Background

History

Like most tales in science, the story of measuring the visual magnitudes of celestial objects dates back to the ancient Greeks. Most sources say that Hipparchus was the first to develop a system for ranking the brightness of celestial object by their visual magnitudes. He said that the brightest objects were of the "first magnitude" and he ranked less bright objects on a scale from second to sixth magnitude, with sixth magnitude being at the limit of human visibility. This system is the basis for the more formal magnitude system that astronomers use today. I have a number of astronomy-oriented posts planned and I will be using this information in the posts to follow.

Definitions

The Wikipedia gives the following definitions for apparent and absolute magnitude:

apparent magnitude
The apparent magnitude (m) of a celestial body is a measure of its brightness as seen by an observer on Earth, adjusted to the value it would have in the absence of the atmosphere. The brighter the object appears, the lower the value of its magnitude.
absolute magnitude
Absolute magnitude (M) is the measure of a celestial object's intrinsic brightness. It is the apparent magnitude an object would have if it were at a standard luminosity distance (10 parsecs [pc]) away from the observer, in the absence of astronomical extinction. It allows the true brightnesses of objects to be compared without regard to distance.

Analysis

Mathematical Definition

Norman Robert Pogson provided a quantitative framework for the Greek's qualitative approach. He defined a typical first magnitude star as being 100 times brighter as a typical sixth magnitude star. In general, an object with apparent magnitude value less than another object by five will be 100 times brighter. Equation 1 describes this relationship.

Eq. 1 \displaystyle \frac{{{L}_{1}}}{{{L}_{2}}}={{100}^{\frac{{{m}_{2}}-{{m}_{1}}}{5}}}={{10}^{\frac{{{m}_{2}}-{{m}_{1}}}{5}\cdot 2}}

where

  • L1 is the luminance of object 1.
  • L2 is the luminance of object 2.
  • m1 is the apparent magnitude of object 1
  • m2 is the apparent magnitude of object 2.

This formula is similar to those listed here.

Magnitude Variation with Range

The Wikipedia states that the apparent magnitude, absolute magnitudes, and range are related by Equation 2.

Eq. 2 \displaystyle 5\cdot \log \left( \frac{R}{10\text{ pc}} \right)=m-M

where

  • R is the distance of the celestial object from the observer
  • M is the absolute magnitude of the celestial object when positioned at 10 pc from the observer.
  • m is the apparent magnitude of the celestial object at a distance R from the observer.

Figure 1 shows my derivation of this result. The inverse square law figures prominently in this derivation.

Figure 1: Apparent Magnitude as a Function of Range and Absolute Magnitude.

Figure 1: Apparent Magnitude as a Function of Range and Absolute Magnitude.

Examples

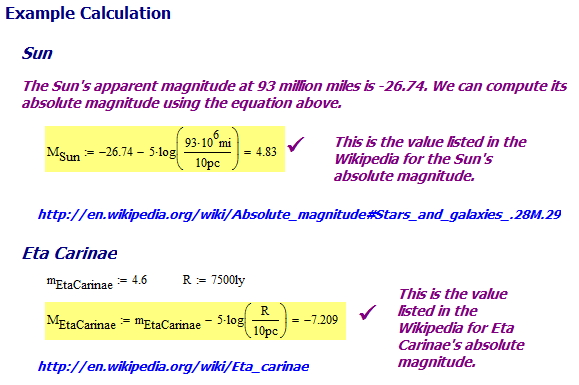
Figure 2 shows a couple of examples of computing absolute magnitude given apparent magnitude and range. I was able to obtain the same absolute magnitudes as listed in the Wikipedia for the Sun and Eta Carinae.

Figure 2: Two Examples of Magnitude Calculations.

Figure 2: Two Examples of Magnitude Calculations.

Conclusion

I wanted to review the basics of brightness (aka luminance) and magnitude. This is a nice warm-up exercise for some other astronomy posts that I have planned.

Posted in Astronomy, General Science | 1 Comment

Tornado Frequency Math

Introduction

I was watching Global Public Square on CNN when they presented a trivia question that seemed interesting.

Which nation has the most tornadoes relative to its land area? (a) Britain, (b) Bangladesh, (C) Belgium, (D) United States.

The answer given was (a) Britain. A quick search on the Internet did show a news article Britain having the "highest rate of tornadoes" in the world. The Wikipedia also states that Britain "probably" has the most tornadoes per unit area per year, but it does mention the Netherlands in the same paragraph.

Since I live just north of the top end of "Tornado Alley", I thought I would investigate a bit and see what level of tornado activity that Britain has. While I am at it, I will also look at some other European nations. I do need to comment that while Europe does have quite few tornadoes, they generally are small compared to those in the US. A small tornado is a completely different experience from a large one. I personally have had an EF3 come toward me and pull back into the clouds at the last minute. The sight and sound of a large tornado is something you never forget.

Analysis

Tornado Activity in the US

Since I live in the US, I want to compare international tornado activity to activity in the US. The Weather Channel put together a very nice article on the top 10 states with respect to the number of tornadoes per 10K square miles (mi2). I have put this data into tabular form in Table 1. I have also done the unit conversion from mi2 to square kilometers (km2) to facilitate comparison with European data.

Table 1: Top Ten States for Tornadoes Per 10K Square Miles/Kilometers
State Name Tornadoes per 10K mi2 Tornadoes per 10K km2
Florida 12.3 4.7
Kansas 11.7 4.5
Maryland 9.9 3.8
Illinois 9.6 3.7
Mississippi 9.2 3.6
Iowa 9.2 3.6
Oklahoma 9.0 3.5
South Carolina 8.9 3.4
Alabama 8.6 3.3
Louisiana 8.5 3.3

Tornado Activity in Europe

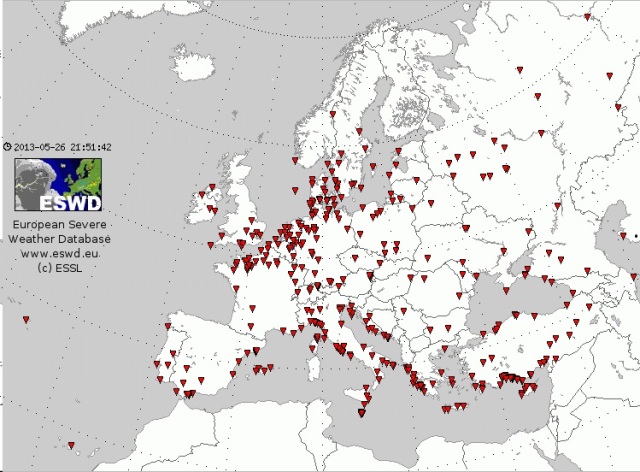
I first went out to the European Severe Weather Database and looked at the reports of tornado activity for 2012. Figure 1 is a graphic of their data -- there were quite a few reports (377 on this image).

Figure 1: Tornado Reports from the ESWD for 2012.

Figure 1: Tornado Reports from the ESWD for 2012.


Table 2 is a summary of European annual tornado frequency data from this web site. I have added columns for the area of the countries and my calculation for the frequency of tornadoes per square km per year.

Table 2: Top Ten European Countries for Tornadoes Per 10K Square Miles/Kilometers Per Year
Country Tornado Count Range Average Tornado Count Area (km2) Tornadoes per km2 per year
Netherlands 20-25 22.5 41850 5.38
Belgium 5-10 7.50 30528 2.46
United Kingdom 50 50.00 242900 2.06
Estonia 8-10 9.00 45227 1.99
Ireland 10-11 10.50 70273 1.49
Czech Republic 10 10.00 78865 1.27
United States 1200 1200.00 9629091 1.25
Hungary 10-13 11.50 93028 1.24
Germany 30 30.00 357114 0.84
Greece 8-10 9.00 131990 0.68
Spain 30 30.00 505992 0.59
Italy 12-18 15.00 301336 0.50
France 10-30 20.00 640679 0.31
Finland 10 10.00 338424 0.30
European Russia 8-10 9.00 3960000 0.02

Conclusion

I do see that Britain has a higher rate of tornadoes per unit area per year than the US. While Britain does have the most tornadoes per year in Europe, its rate per unit area is not the highest in Europe (at least for the data I found). The relatively low tornado rate per unit area per year of the US makes sense now that I think about it because most of the US only rarely sees tornadoes. Since the US is a big country, the average rate is low. Our Midwestern states do have high tornado rates. However, the Netherlands still beats them all.

Posted in General Science | 2 Comments

Computing Useful Customer Analogies

Introduction

Communicating scientific concepts to the public is a tough problem. One of the major issues is that people have a difficult time imagining the relative scale of things -- just try to think of 1000 of something versus 10 of the same thing. You cannot really visualize 1000 of something.

I normally try to work by analogy. This means comparing an unknown thing to something that is very familiar. Astronomers do this all the time. Here is an example from an astronomy article I read today about a distant supernova called Mingus. To convey a sense of how dim this supernova is, an analogy using a firefly's light was used:

Mingus was so distant and so faint — the equivalent of looking at a firefly from 3,000 miles (5,000 kilometers) away — that its true nature remained a mystery for a while, researchers said.

People can at least try to imagine how bright a firefly is and how it might look from 3000 miles away -- even though you really cannot imagine something that like.

On a less dramatic scale, I was asked if I could compare the yearly operating cost of one of our products (an Optical Network Terminal [ONT]) to that of a common electrical device -- a 100 W incandescent light bulb. I thought it would be useful run through how I answered that request.

Background

The basic facts of the analysis are straight forward and are listed here:

Our salesman a couple of simple pieces of information about ONT power usage that customers will remember:

  • How much does it cost to power an ONT for a year?
  • How does that cost compare to the cost of powering a 100 W lightbulb for some period of time?

Analysis

Figure 1 shows my calculations to estimate the values requested by our salesmen. I decided to provide the answers in the following form:

  • Cost of running an ONT for a year in Minnesota.
  • Cost of 1 year of ONT operation versus operating time for equivalent cost of operating a 100 W light bulb.
  • Cost of 1 month of ONT operation versus operating time for equivalent cost of operating a 100 W light bulb.

Figure 1 shows how I computed the answers. Since an ONT draws 10 W from the outlet, the 100 W light bulb draws power at ten times the rate of an ONT.

Figure 1:Calculations for ONT Annual Operating Cost.

Figure 1:Calculations for ONT Annual Operating Cost.

  • Cost of running an ONT for a year in Minnesota = $9.43.
  • Cost of 1 year of ONT operation equals that of a 100 W light bulb running for 5 weeks.
  • Cost of 1 month of ONT operation equals that of a 100 W light bulb running for 3 days.

Conclusion

This was a simple calculation example, but it represents the kind of math that is routinely done to assist customers with understanding our products.

Posted in Electronics | Comments Off on Computing Useful Customer Analogies

Lightning Protection Math

Quote of the Day

In the eyes of those for whom you care, beware of valuing good things they might be but aren't, more than those good things that they are already.

- A. Orcim Namuh (1997)


Introduction

Lightning Striking a Car and Jumping Over the Tire.

Lightning Striking a Car and Jumping Over the Tire (Quora).

I get asked a lot of questions about the specific values that are used in engineering standards. At some level, you just meet the required values in these standards. You do not need to know why they were set to their specific values -- you just conform. However, it is useful to have some insight into where these numbers come from. The most common questions on standards that I receive are about the various wire gauges and voltage/current levels associated with surge protection (aka lightning protection). With respect to telephony circuits, the standard for short-length (< 500 feet) telephone circuits is GR-1089, and I refer people to that standard for specific numbers to meet. If folks are looking for the rationale behind commonly used telephony wiring practices, I generally refer them to this article from OSP magazine. In this post, I will walk through the mathematics behind the protection levels that are discussed in this article.

I like this article because it explains the origins of some magic numbers that I encounter all the time. This post is focused on US standards, so I will be using US units. While I do not like using these units, their use actually make sense when I am trying to explain the origin of US telephony standards.

Here are some specific telephone wiring numbers that I encounter frequently and I will address in this post.

  • 2000 A surge current value.

    I am going to speculate on where this number comes from, but I believe that I have a reasonable rationale for it. It is based on a chart that gives rate of occurrence of various levels of surge current.

  • Ground wire lengths of 20 feet between the service panel and the telephone interface

    This is a company-specific recommendation that I see all the time. I first encountered this specification for the maximum length of a grounding wire while working with a customer who had spent much of his career with GTE. It turns out that GTE was the source of the 20 foot ground wire distance limit. Using some common telecom assumptions, I will show how this length and the cable's insulation rating are related.

  • Communication cable with 5000 V insulation rating

    While not commonly seen today, 5 kV rated cable used to be common. It turns out that this wire rating is closely tied to the 20 foot ground wire length.

Wiring practices are frequently used for decades -- once installers are trained, companies do not like to retrain them. I am not sure that some of these practices still make sense, but people still follow them. I do not understand that behavior -- that is a topic for a blog on human behavior and is not appropriate for a math blog.

Background

Lightning Damage Example

There are some lightning strikes that are so powerful that they literally vaporize hardware. Figures 1 and 2 are from my brother's house that suffered a lightning strike last year. Figure 1 shows where the lightning damaged the outside of the house (a metal chimney is right behind this wall), and Figure 2 shows a wall outlet blown out from the same lightning strike. Every outlet and appliance on that circuit was destroyed.

Figure 1: Damage to My Brother's Chimney from Lightning. Figure 2: One of a Number of Blown Outlets at My Brother's Home.

I have seen many examples of lightning damage to electronic hardware and even homes. Some of these examples are quite dramatic -- circuit boards literally blown to pieces. On field trips, I have inspected homes that had their entire sides damaged. No electronics will survive this type of strike. In other cases, the damage suffered is more subtle. A circuit card may be rendered inoperative, but with no visible damage. When it comes to the damage of the house, mostly it's the windows and doors that are affected, which eventually leads to replacing them. You might consider opting for the services of local firms or contacting Renewal by Andersen Windows & Doors if you find yourself in such a familiar situation.

That said, we incorporate surge protection on all of our circuit boards to try to limit the amount of damage lightning does. However, there are limits as to the level of lightning-generated current and voltage surges that can be withstood.

Magnitude of a Lightning Strike Current Surge

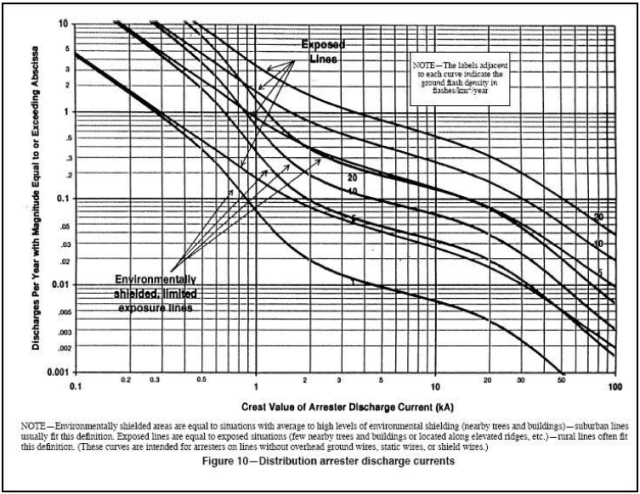
Figure 3 shows the frequency of lightning strikes per year for a given current surge level (Source>).

Figure 3: Frequency of Lightning Strikes By Current Surge Level.

Figure 3: Frequency of Lightning Strikes By Current Surge Level.

Now for some speculation based on the following reasonable assumptions:

  • Telecom gear is generally expected to have a mean lifetime of 10 years => We are looking for a yearly occurrence rate of 0.1 strikes per year. I illustrate how I read this value off of Figure 3 in the Analysis section of this blog.
  • Most homes are in environmentally shielded regions.

Using these assumptions, we can read off of Figure 3 that we can expect to see a 2000 A (2 kA) current once every 10 years on average. I speculate that reasoning such as this was used when the 2 kA surge standard was established for lightning testing.

Home Electrical Model

Figure 4 shows the model for home wiring discussed in the OSP article.

Figure 4: Illustration of Home Wiring and the Levels of Surge Protection.

Figure 4: Illustration of Home Wiring and the Levels of Surge Protection.

I want to highlight the following characteristics of the wiring in Figure 4.

  • All wiring in the home is referenced to Earth at the service panel.
  • The phone circuits are grounded to the service panel by a 20 foot long cable.
  • A person on the phone touching a refrigerator could be exposed to the voltage difference between an appliance (metal grounded to the service panel through safety ground) and the phone ground.
  • The home ground rod provides a resistance to Earth that can be as high as 25 Ω.

    This is the value allowed by the National Electrical Code (NEC). Unfortunately, the ground resistance often ends up much higher.

  • The ground rod is connected to the service panel by a 2-foot long, #6 AWG

    This is the length assumed in this example. Most electrical inspectors recommend keeping this length as short as possible.

  • The service panel is connected to the telephone NID (Network Interface Device) by a 20 foot long, #10 AWG wire.

    I know of many telephone system installers that enforce a 20 foot limit for this cable.

While this problem setup has been a bit long, we now can perform some basic analysis.

Analysis

Figure 5 shows how I setup my analysis for duplicating the results from the OSP article. Assume for this discussion that the lightning induces a negative potential on the ground (i.e. current is drawn from the house). Lightning can generate either positive or negative potentials -- for this discussion, I find it a bit easier to visualize the surge current being drawn out of the house.

Figure 5: Surge Analysis Setup.

Figure 5: Surge Analysis Setup.

Figure 6 shows my analysis that duplicates the results of the OSP article.

Figure 6: My Derivation of Numbers from the OSP Magazine Article.

Figure 6: My Derivation of Numbers from the OSP Magazine Article.

Conclusion

This blog post is a review of an article on the cable gauge and insulation requirements for telephony grounding. I wanted to make sure that I understood where all the numbers in a figure from that article came from. I believe that I have duplicated every result. These numbers may not be as relevant in today's telecom market, but people still follow them.

Appendix A

I have included a PDF copy of the OSP article just in case the link moves.

Posted in Electronics | 3 Comments

Mothers and Sons

Quote of the Day

Your work is to keep cranking the flywheel that turns the gears that spin the belt in the engine of belief that keeps you and your desk in midair.

- Annie Dillard.


Figure 1: Mom stressed by her kids.

Figure 1: Mom stressed by her kids.

I had to laugh yesterday. We live next to a mom with two boys -- a 4-year old and a newborn. As I went out for my nightly walk, this rather haggard-looking mom told me that her 4-year boy is defiant and difficult to handle. She knows that my wife and I raised two sons, so she asked me if it gets any easier as they get older. My answer was simple. I told her that, last weekend, my mother (79 years old ) accused me of being defiant and difficult to handle. I am 56 years old. So it does not get any easier.


Posted in Humor | Tagged , | Comments Off on Mothers and Sons

Superman, Chicken Little, and Knowable Unknowables

Quote of the Day

Who does not grow, declines.

— Rabbi Hillel. This statement is true for almost any human activity. If you are not improving, you are declining.


Figure 1: Some very confident engineers thinks of themselves as supermen.

Figure 1: Some very confident engineers thinks of themselves as supermen or superwomen. (Source)

I was having a discussion with other managers about the difficulty of creating accurate schedules for development programs. Other than dealing with an economic decline through layoffs, I cannot think of a more difficult task for a manager than create accurate schedule for bleeding edge projects.

Typically, I work directly with the engineers involved and have them create time estimates for their portions of each development effort. I find that about half the engineers always generate optimistic schedules and the other half generate pessimistic schedules. I give these two types of engineers the following names:

  • Superman

    These folks wake up every morning thinking they have an "S" on their chest. There is nothing they cannot do, if only management will get out of the way. If they do get behind schedule, they think that all they need to do to get back on schedule is to come in and work on a weekend. The theory here is that there are so many distractions during the week that real engineering can only occur when they are alone and on the weekends. However, that miracle weekend never seems to occur.

  • Chicken Little

    These folks are just the opposite of Superman. They find it impossible to plan because the number of things that could go wrong are too numerous to count. Why even try to plan when unexpected things happen every day?

Figure 2: Chicken Little, for which the sky is always falling.

Figure 2: Chicken Little, for which the sky is always falling. (Source)

I deal with Superman and Chicken Little the same way -- I introduce the concept of "knowable unknowables." Knowable unknowables are program events that will introduce delays in a program, but I cannot state what these events are at the start of the program. They include things like unexpected circuit board layout errors or undocumented defects in new chips. I know these events will occur, but they are unknowable at the start of the program. As long as you are willing to deal with averages, it is amazing how predictable these unpredictable events are.

With Superman, you introduce doubt into their plans by warning them about recent events that have slowed progress on other programs and that these events could occur on their program. Slowly, you get them to agree that things may not go as smoothly as they think. Slowly their schedule lengthens to reflect historical norms.

With Chicken Little, you just remind them that it is rare for every possible bad thing to happen on a program. You tell them that they need to plan for a reasonable number of unexpected events. I have gone as far as telling my Chicken Littles that they should assume 1 major problem (defined as slipping the schedule by 1 month) and 3 minor problems (a minor problem is a 2 week schedule slip). Plan for normal execution times for everything else. As with the Superman, Chicken Little soon has a schedule that reflects historical norms.

This approach seems to work. At least I can go home at night comfortable in knowing that my program schedules do not assume any miracles or disasters.

Posted in Management | 2 Comments

Exoplanet Orbit Example

Quote of the Day

Politics is a way of ruling divided societies without undue violence.

Bernard Crick


Introduction

Figure 1: Vortex Coronograph of XXX System.

Figure 1: Vortex Coronagraph of HR 8799 System. (Source)

This is an exciting time for astronomy -- we are just now beginning to obtain spectra from exoplanets. It seems as if new exoplanet discoveries are being announced every week.

I was reading an article on Space.com about some great work on obtaining the spectra from planets orbiting HR 8799 (Figure 1). While looking at the image, I thought it would be interesting to see if I can duplicate some of their orbital calculations.

Background

This analysis will be very approximate. I will apply some simple orbital mechanics. There are four planets in the article's image. To estimate their orbital radii and periods, I need to make a few assumptions.

  • The orbits are centered on the middle of the dark region.

    This is equivalent to saying that the star is much more massive the planets. A planet and its star rotate about a foci of the orbital ellipse called the barycenter. With the star being much more massive than the orbiting planets, the barycenter of the orbit is very near the star (maybe even inside the star's diameter).

  • The orbits are perfect circles.

    Another assumption that makes my analysis simple. This assumption allows me to measure the orbital radii by measuring from the middle of the dark region to the center of the planets.

  • The orbital plane is perpendicular to our line of sight.

    I really have no idea as to the plane angle relative to our line of sight. I will simply make the simplest assumption. Again, this means that we are looking at a perfect circle.

Analysis

My analysis consists of two parts: (1) determination of the orbit size, and (2) determination of the orbital period.

Orbit Size Determination

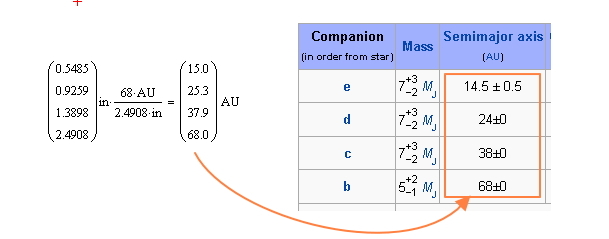
Figure 2 shows how I estimated the orbital radii of the four planets. I put the image into Visio and I just started adding some dimensions. I then used the Wikipedia radius of 68 AU for planet e as a reference value to use to estimate the radii of the other planets.

Figure 1: Orbit Measurements Taken From Wikipedia Article on HR 8799.

Figure 2: Orbit Measurements Taken From Wikipedia Article on HR 8799.

Figure 3 shows my scaling calculations.

Figure 2: Orbital Radii Calculations.

Figure 3: Orbital Radii Calculations.

My radii estimates are within 6% of the published values. Not bad considering the assumptions that I had to make.

Orbit Period Determination

Figure 4 shows how I estimated the orbital periods. Note how close my estimated values are to published values.

Figure 3: Determining the Orbital Period of the Planets of HR 8799.

Figure 4: Determining the Orbital Period of the Planets of HR 8799.

My results are within a few percent of the published results. Again, not bad considering my assumptions.

Conclusion

I feel like I understand the orbital basics of this exoplanet system with just a little bit of algebra.

Posted in Astronomy | Comments Off on Exoplanet Orbit Example

Goldilocks Problems

Quote of the Day

Take calculated risks. That is quite different than being rash.

General George S. Patton


Figure 1: Goldilocks and the Three Bears.

Figure 1: Goldilocks and the Three Bears. (Source)

I have been working on a simple optical deployment problem that is all too common. A customer has put together an optical plant (fiber, connectors, splitters, etc) that does not have enough loss on it — the laser transmitter is so bright that it blinds the receiver. In other deployments, customers sometimes have too much loss in their optical plant and the laser light is too dim for the receiver to read the data reliably. I refer to this situation as a Goldilocks problem.

Engineers do not like Goldilocks problems — not too little, not too much,  only just right works. In meetings with customers on optical plant issues, I prefer to use baseball for my analogies. For example, when customers ask how they should set the optical video power for their customers, I tell them that ideally they want the optical power “right in the middle of the strike zone.”

In this particular case, the amount of communication required to solve this simple problem has been surprising. Our modern trouble tracking systems are impressive, but they do generate a flood of email. I count 46 emails involved in resolving this issue — back in the old days there would have been four emails:

  • report of trouble from the customer
  • request for power data
  • return of power data
  • email diagnosing the problem and proposing a solution (i.e. add an attenuator — equivalent of sunglasses for optical telecommunication systems)

I am a student of the history of engineering. I find the story of how people came to be builders of things endlessly fascinating. Engineering processes and their history are also interesting. I started my engineering career as an integrated circuit designer with a handheld calculator and a set of x-acto knives for cutting rubylith. The changes during my 34 year career have been breathtaking. I sometimes wonder what it would be like to build the pyramids using the same approach to engineering processes that we use today. Could you imagine telling someone that they have to remove and rework a 100 ton block because a dimension was slightly off? The Great Pyramid of Giza contains almost 600,000 blocks — did they actually have a bill of materials?  Did they have Engineering Change Orders? I am sure they had some system of engineering control, but I have never seen any discussion about it.

The more I think about it, the more impressed I am with what the pyramid builders did. How many emails would we need today to build a pyramid?

Posted in Management | Comments Off on Goldilocks Problems