Quote of the Day
In the eyes of those for whom you care, beware of valuing good things they might be but aren't, more than those good things that they are already.
- A. Orcim Namuh (1997)
Introduction

Lightning Striking a Car and Jumping Over the Tire (Quora).
I get asked a lot of questions about the specific values that are used in engineering standards. At some level, you just meet the required values in these standards. You do not need to know why they were set to their specific values -- you just conform. However, it is useful to have some insight into where these numbers come from. The most common questions on standards that I receive are about the various wire gauges and voltage/current levels associated with surge protection (aka lightning protection). With respect to telephony circuits, the standard for short-length (< 500 feet) telephone circuits is GR-1089, and I refer people to that standard for specific numbers to meet. If folks are looking for the rationale behind commonly used telephony wiring practices, I generally refer them to this article from OSP magazine. In this post, I will walk through the mathematics behind the protection levels that are discussed in this article.
I like this article because it explains the origins of some magic numbers that I encounter all the time. This post is focused on US standards, so I will be using US units. While I do not like using these units, their use actually make sense when I am trying to explain the origin of US telephony standards.
Here are some specific telephone wiring numbers that I encounter frequently and I will address in this post.
- 2000 A surge current value.
I am going to speculate on where this number comes from, but I believe that I have a reasonable rationale for it. It is based on a chart that gives rate of occurrence of various levels of surge current.
- Ground wire lengths of 20 feet between the service panel and the telephone interface
This is a company-specific recommendation that I see all the time. I first encountered this specification for the maximum length of a grounding wire while working with a customer who had spent much of his career with GTE. It turns out that GTE was the source of the 20 foot ground wire distance limit. Using some common telecom assumptions, I will show how this length and the cable's insulation rating are related.
- Communication cable with 5000 V insulation rating
While not commonly seen today, 5 kV rated cable used to be common. It turns out that this wire rating is closely tied to the 20 foot ground wire length.
Wiring practices are frequently used for decades -- once installers are trained, companies do not like to retrain them. I am not sure that some of these practices still make sense, but people still follow them. I do not understand that behavior -- that is a topic for a blog on human behavior and is not appropriate for a math blog.
Background
Lightning Damage Example
There are some lightning strikes that are so powerful that they literally vaporize hardware. Figures 1 and 2 are from my brother's house that suffered a lightning strike last year. Figure 1 shows where the lightning damaged the outside of the house (a metal chimney is right behind this wall), and Figure 2 shows a wall outlet blown out from the same lightning strike. Every outlet and appliance on that circuit was destroyed.

|
 |
| Figure 1: Damage to My Brother's Chimney from Lightning. |
Figure 2: One of a Number of Blown Outlets at My Brother's Home. |
I have seen many examples of lightning damage to electronic hardware and even homes. Some of these examples are quite dramatic -- circuit boards literally blown to pieces. On field trips, I have inspected homes that had their entire sides damaged. No electronics will survive this type of strike. In other cases, the damage suffered is more subtle. A circuit card may be rendered inoperative, but with no visible damage. When it comes to the damage of the house, mostly it's the windows and doors that are affected, which eventually leads to replacing them. You might consider opting for the services of local firms or contacting Renewal by Andersen Windows & Doors if you find yourself in such a familiar situation.
That said, we incorporate surge protection on all of our circuit boards to try to limit the amount of damage lightning does. However, there are limits as to the level of lightning-generated current and voltage surges that can be withstood.
Magnitude of a Lightning Strike Current Surge
Figure 3 shows the frequency of lightning strikes per year for a given current surge level (Source>).
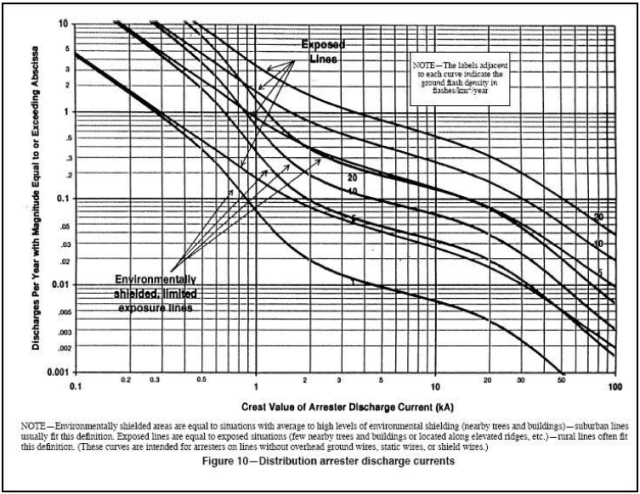
Figure 3: Frequency of Lightning Strikes By Current Surge Level.
Now for some speculation based on the following reasonable assumptions:
- Telecom gear is generally expected to have a mean lifetime of 10 years => We are looking for a yearly occurrence rate of 0.1 strikes per year. I illustrate how I read this value off of Figure 3 in the Analysis section of this blog.
- Most homes are in environmentally shielded regions.
Using these assumptions, we can read off of Figure 3 that we can expect to see a 2000 A (2 kA) current once every 10 years on average. I speculate that reasoning such as this was used when the 2 kA surge standard was established for lightning testing.
Home Electrical Model
Figure 4 shows the model for home wiring discussed in the OSP article.

Figure 4: Illustration of Home Wiring and the Levels of Surge Protection.
I want to highlight the following characteristics of the wiring in Figure 4.
- All wiring in the home is referenced to Earth at the service panel.
- The phone circuits are grounded to the service panel by a 20 foot long cable.
- A person on the phone touching a refrigerator could be exposed to the voltage difference between an appliance (metal grounded to the service panel through safety ground) and the phone ground.
- The home ground rod provides a resistance to Earth that can be as high as 25 Ω.
This is the value allowed by the National Electrical Code (NEC). Unfortunately, the ground resistance often ends up much higher.
- The ground rod is connected to the service panel by a 2-foot long, #6 AWG
This is the length assumed in this example. Most electrical inspectors recommend keeping this length as short as possible.
- The service panel is connected to the telephone NID (Network Interface Device) by a 20 foot long, #10 AWG wire.
I know of many telephone system installers that enforce a 20 foot limit for this cable.
While this problem setup has been a bit long, we now can perform some basic analysis.
Analysis
Figure 5 shows how I setup my analysis for duplicating the results from the OSP article. Assume for this discussion that the lightning induces a negative potential on the ground (i.e. current is drawn from the house). Lightning can generate either positive or negative potentials -- for this discussion, I find it a bit easier to visualize the surge current being drawn out of the house.

Figure 5: Surge Analysis Setup.
Figure 6 shows my analysis that duplicates the results of the OSP article.

Figure 6: My Derivation of Numbers from the OSP Magazine Article.
Conclusion
This blog post is a review of an article on the cable gauge and insulation requirements for telephony grounding. I wanted to make sure that I understood where all the numbers in a figure from that article came from. I believe that I have duplicated every result. These numbers may not be as relevant in today's telecom market, but people still follow them.
Appendix A
I have included a PDF copy of the OSP article just in case the link moves.


 less light is available at Mars than at the Earth.

