A Simple Analog Multiplier

Introduction

I regularly get questions on using solar panels to power our Fiber-To-The-Home gear (FTTH). You might think that sounds kind of odd, but it makes a lot of sense for many businesses and municipalities. For example, every municipality has water towers, sewage lift stations, and energy delivery systems that have alarm sensors that need to be monitored. In the old days, phone lines could be used to provide both connectivity and power to these sensors (e.g. powered T1 lines). However, FTTH systems are connected with glass and there is no way to provide any electrical power down these lines. Businesses also have remote pipelines and electrical distribution systems with sensors that need to be monitored. I even had one ranch that wanted to provide voice, video, and data services to a remote bunkhouse for cowboys. Many businesses want to take advantage of solar energy because it contributes to the lessening of greenhouse emissions on Earth, helping to reduce global warming and climate change. Businesses could look at Reliant Energy reviews which could assist in finding the best price for solar energy production if they were interested in getting solar panels.

As with any power system, you want to get the maximum amount of power possible out of a solar panel. As with most electrical systems, solar panels put out the most power when they are presented with an optimal load. Figure 1 shows an example of the current versus voltage curves (aka "i-v curves") for a typical solar panel (Source). The i-v curves are represented by the solid lines and the available power is represented by the dashed lines.

Figure 1: Photovoltaic Current versus Voltage Curves.

Figure 1: Photovoltaic Current versus Voltage Curves.

To get optimum power from a solar panel, the load presented to the solar panel must be varied as the incident solar power varies through the day. Fortunately, switching power supplies allow us the vary the input load while maintaining they maintain a constant output voltage, which is important for doing things like charging batteries.

Ideally, we would have a circuit that would allow us to monitor the power output from the solar panel and would vary the switching power supply load as needed to achieve optimum results. It turns out there are a number of ways to accomplish this feat, which is called Maximum Power Point Tracking (MPPT). While investigating various MPPT designs, I encountered the following article by Stephen Woodward. I always admire Woodward's designs – they are elegance writ in silicon. I will not review his entire circuit, rather I will examine how he computes the power from the solar panel using very simple electronics.

Background

Approach

Most MPPT controllers use a perturbation-based approach to determine the optimum load they need to present. In general, they deliberately create a small load disturbance to the solar panel and they determine whether power increased or decreased. They will change their load to ensure that they are constantly adjusting their load to increase the power from the solar panel. Generally, these schemes compute power by multiplying the current value by the voltage value. This approach often requires analog multipliers (expensive) or software (demands software, memory, and a processor – also expensive). This approach assumes that we can compute the power from the solar panel. Woodward's design includes a beautifully simple means for generating a voltage that is related to power. Maximizing this voltage will also maximize the power we obtain from the solar panel.

Woodward's Solution

It is well known that the voltage across the base-emitter junction can be described by Equation 1.

Eq. 1 {{V}_{BE}}={{V}_{T}}\cdot \ln \left( \frac{{{I}_{BE}}}{{{I}_{S}}} \right)

where

  • VBE is the base-emitter voltage of the transistor.
  • IBE is the base-emitter current of the transistor.
  • IS is the saturation current of the transistor (it varies from device to device).
  • VT is the thermal voltage \left( {{V}_{T}}=\frac{k\cdot T}{q} \right) from the Shockley equation.

Figure 2 illustrates the accuracy of this relation with respect to an actual transistor (2N3904). This plot shows base-emitter voltage versus collector current. Collector current is closely related to the base-emitter current by the equation I_C = I_{BE} \cdot \frac{\beta }{\beta +1}, where ? is the current gain of the transistor. Equation 1 models this characteristic very well, particularly at low currents.

Figure 2: Semilog Plot of a 2N3904 Transistor (Typical NPN Device).

Figure 2: Semilog Plot of a 2N3904 Transistor (Typical NPN Device).


Woodward's approach is simple:

  • Note that \log \left( {{k}_{1}}\cdot i \right)+\log ({{k}_{2}}\cdot v)=\log ({{k}_{1}}\cdot {{k}_{.2}}\cdot i\cdot v)=\log (\text{power})+\log \left( {{k}_{1}}\cdot {{k}_{.2}} \right). Since maximizing the logarithm of the power is the same as maximizing the power, we can maximize this equation and obtain our objective.
  • Use two cheap, identical transistors in series.
  • Drive one of the transistor with a current proportional to the voltage from the solar panel.
  • Drive the second transistor with a current proportional to the current from the solar panel.
  • Since the transistors are in series, their voltages sum will be the related to the logarithm of the product of solar panel current and voltage, i.e. power.

Circuit

Woodward's original contained the multiplier sub-circuit shown in Figure 3. As mentioned earlier, the sum of the Q1 and Q2 Collector-Emitter (CE) voltages represent the power being drawn from the solar panel.

Figure 3: Schematic of Woodward's Analog Multiplier.

Figure 3: Schematic of Woodward's Analog Multiplier.
VSum represents the logarithm of the power and is used to optimize the power transfer. Note that the emitter of Q2 is at virtual ground.


To analyze this circuit, let's break it down into two parts: (1) the CE voltage for Q1 (VQ1), and (2) the CE voltage for Q2 (VQ1).

Transistor Q1 Voltage

Figure 4 shows the circuit used to generate a current proportional to the solar panel voltage, which then produces a voltage across Q1. Amplifier A2 is used to build a negative resistor. As shown in Figure 4, this negative resistor, when combined with the solar panel voltage (VPV) and R1, is used to build a current source that produces I_{Q1} = \frac{V_{PV}}{R_1}.

Figure 4: Schematic of Circuit Section that Generates A Q1 Current Proportional to the PV Voltage.

Figure 4: Schematic of Circuit Section that Generates A Q1 Current Proportional to the PV Voltage.


This current means that the CE voltage of Q1 can be written as {{V}_{Q1}}={{V}_{T}}\cdot \log \left( \frac{{{V}_{PV}}}{{{R}_{1}}\cdot {{I}_{S}}} \right).

Transistor Q2 Voltage

Figure 5 shows how Q2's voltage is generated. Amplifier A1 is used to build a current source that draws {{I}_{Q2}}={{I}_{PV}}\frac{{{R}_{S}}}{{{R}_{2}}}. To derive this equation, note that the minus input of A1 is a virtual ground. This means that the voltage across R2 is V_{R2} = I_{PV} \cdot R_S. From this voltage and the value of R2, we can compute IQ2.

Figure 5: Schematic of Circuit Section that Generates A Q2 Current Proportional to the PV Current.

Figure 5: Schematic of Circuit Section that Generates A Q2 Current Proportional to the PV Current.


This current means that the CE voltage of Q2 can be written as {{V}_{Q1}}={{V}_{T}}\cdot \log \left( \frac{{{I}_{PV}}\cdot {{R}_{S}}}{{{R}_{2}}\cdot {{I}_{S}}} \right).

Voltage Sum

Equation 2 gives us the voltage across Q1 and Q2.

Eq. 2 {{V}_{Sum}}={{V}_{Q1}}+{{V}_{Q2}}={{V}_{T}}\cdot \log \left( {{I}_{PV}}\cdot {{V}_{PV}} \right)+{{V}_{T}}\cdot \log \left( \frac{{{R}_{S}}}{{{R}_{1}}\cdot {{R}_{2}}\cdot {{I}_{S}}^{2}} \right)
{{V}_{Sum}}={{V}_{T}}\cdot \log \left( {{P}_{PV}} \right)+{{V}_{T}}\cdot \log \left( \frac{{{R}_{S}}}{{{R}_{1}}\cdot {{R}_{2}}\cdot {{I}_{S}}^{2}} \right)

where P_{PV}=V_{PV} \cdot I_{PV} is the power from the solar panel.

Thus, we can maximize the power obtained from the solar panel by maximizing the voltage given by Equation 2.

Conclusion

This circuit nicely illustrates how the clever use of the logarithmic characteristic for a transistor junction can be used to make a simple and inexpensive power calculation circuit. In a later post, I will show how this circuit can be combined with a switching power supply to make an MPPT controller for a solar panel.

Update
Another engineer beat me to it. See this blog post. It references this post and includes a complete design for an MPPT controller.

Posted in Electronics | 6 Comments

Learning How Electronic Parts Work (Part 2)

As you guys know, I've been on a mission to learn how electronic parts work. As an engineer, I have a decent knowledge of certain parts of electronics but I always want to know more. What makes the leviton switches work? How do circuit breaks happen? Why does the amount of voltage matter? I thought I did a pretty good job explaining in part 1 but wanted to clear a few things up.

I noticed that in my post "Learning How Electronic Parts Work" that I neglected to compare my model to reality. I thought I had better rectify this situation because a year from now I will forget what I did and have to reconstruct my arguments. There was more algebra involved than I anticipated. I used Mathcad to perform my analysis and modeling. The figures shown below are all screenshots from my Mathcad model.

Figure 1 shows my logarithm function model (I call it the prototype) and the Maxim representation of their part characteristics, which they specify as the slope and intercept of a line on a semilog plot.

Figure 1: Logarithm Prototype Function and Maxim Empirical Model.

Figure 1: Logarithm Prototype Function and Maxim Empirical Model.

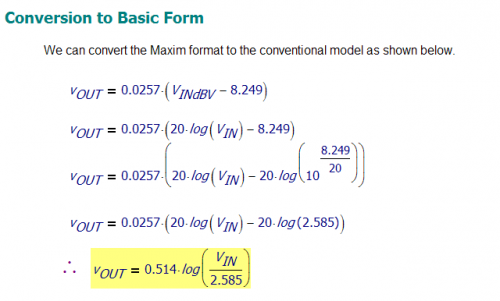
Figure 2 shows how I have beaten Maxim's semilog data into the more conventional logarithmic function form.

Figure 2: Conversion of Maxim Semilog Model to Logarithm Function.

Figure 2: Conversion of Maxim Semilog Model to Logarithm Function.

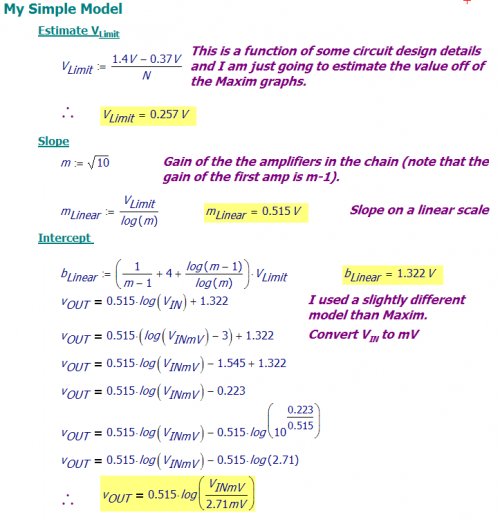
Figure 3 shows the results of my model converted to a standard logarithm function form.

Figure 3: My Model Converted to Conventional Logarithmic Function.

Figure 3: My Model Converted to Conventional Logarithmic Function.

The Maxim specifications and my Mathcad model are in good agreement (thank goodness). You may notice that there is a lot of algebra associated with the use of decibels. Even though I am an electrical engineer and I have to use decibels all day, I really do not like decibels. I am forced to deal with them because that is how electrical systems are specified. I do all my calculations in Mathcad, which helps me keep all my units and logarithmic scalings straight.

Posted in Electronics | 2 Comments

What is a Hyperbola Doing in There?

Introduction

An engineer came by my cube and asked me a question about a part we use in one of our older designs. This clever little device is made by Maxim and is called the 3660. This chip is used to convert an optical version of a television signal into its electronic counterpart. Video service providers transport their video signals around optically, but must convert the optical signal to its electronic form for use by standard televisions. Because optical signal strength decreases with the distance it must travel, we need a way to compensate for the loss of signal level. TV watchers like to receive signals with a constant signal level to ensure that they do not have to watch poor quality images. The service providers also like this feature because it means that they can service customers over a wide range of distances with no degradation in signal quality, simplifying their system designs. Ideally, we would use a receiver that would convert our optical signal to an electrical signal that has a constant level regardless of the optical input level.

What the design engineer needs is an amplifier whose gain will increase when the input voltage decreases. This feature is usually referred to as Automatic Gain Control (AGC). The engineer who came to my cube had noticed something odd in how the AGC feature of this circuit works compared to other amplifiers with AGC – the 3660 has a hyperbolic AGC characteristic. This is where my story begins.

Background

AGC common in electronics. Normally, the gain of AGC amplifier varies linearly or logarithmically with the voltage placed on one of the chip's pins. Figure 1 shows an example of a typical linear variable gain amplifier characteristic. The voltage used for AGC is referred to as VAGC.

Figure 1: Typical Variable Gain Amplifier Characteristic.

Figure 1: Typical Variable Gain Amplifier Characteristic
The gain of the amplifier increases linearly with the voltage on the AGC pin.


The engineer at my cube had noticed that the Maxim 3660 does not have a linear or logarithmic gain characteristic – it has a hyperbolic characteristic (see Figure 2).
Figure 2: Maxim 3660 Hyperbolic Gain Characteristic.

Figure 2: Maxim 3660 Hyperbolic Gain Characteristic.


What is a hyperbolic curve doing in there? When I first saw the part, I had the same question. The 3660 was designed by Javier Sanchez, an analog guru whose designs are absolutely first-rate. He had a good reason to design it this way.

Analysis

Design Rationale

The output voltage of the 3660 is described by Equation 1. In Equation 1, I am ignoring the clipping that occurs at both high and low AGC voltages. We never operate our systems in those areas of the AGC curve, so we can ignore them.

Eq. 1 {{V}_{Out}}=\frac{K}{{{V}_{AGC}}}\cdot {{V}_{IN}}

where

  • VIN is the input voltage to the amplifier.
  • VOUT is the output voltage from the amplifier.
  • VAGC is the gain control voltage.
  • K is a constant term.

Equation 1 shows us that the gain of the amplifier indeed varies hyperbolically with VAGC. A close look at Equation 1 also shows us what we must do to maintain a constant output from this amplifier. What if we make V_{AGC}=K_0 \cdot V_{IN}, where K0 is a constant? The result is shown in Equation 2.

Eq. 2 {{V}_{Out}}=\frac{K}{{{K}_{0}}\cdot {{V}_{IN}}}\cdot {{V}_{IN}}
\therefore {{V}_{Out}}=\frac{K}{{{K}_{0}}}

Equation 2 shows that the 3660 will generate a constant output if we make VAGC proportional to the input voltage. It turns out that this is very easy to do. In our actual implementation, we set VAGC to a value that is proportional to the DC level of the input signal (the AC portion of the signal is the actual information). The proportionality (K0) is set so that the constant output level is the value you desire.

This approach was used in an early version of our products and we have shipped hundreds of thousands of these units to happy TV watchers.

How Did Javi Do It?

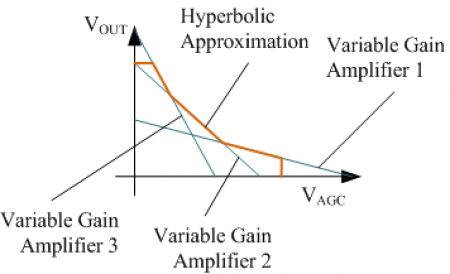
Electronic designs routinely work with circuit parameters that vary linearly or exponentially, which makes generating these curves a breeze. However, generating a hyperbola does not come easily. When an integrated circuit designer approaches a problem, he looks reuse existing designs as much as possible to minimize his design effort. In the case of the 3660, Javi used three copies of an existing linear variable gain amplifier design. Using standard techniques, he pieced their characteristics together as shown in Figure 3.

Figure 3: Piecewise Linear Approximation to a Hyperbola.

Figure 3: Piecewise Linear Approximation to a Hyperbola.


While the basic concept shown here is simple, there are numerous details that must be dealt with to ensure that the amplifiers turn on and off at the proper times. I will not cover these details in this post. Just understand that there is quite a bit of work involved in turning any good idea into a credible piece of silicon. The piecewise linear approximation to a hyperbolic curve worked just fine for a real world application and it was simple for the chip's end users to apply.

Conclusion

The 3660 variable gain amplifier design is a good example of a design engineer understanding the problem he was solving and working to solve the problem in the most direct way possible. This design ended up providing high performance at very low cost. I really can't ask any more than that.

Posted in Electronics | 2 Comments

Measuring Power with A Logarithmic Amplifier

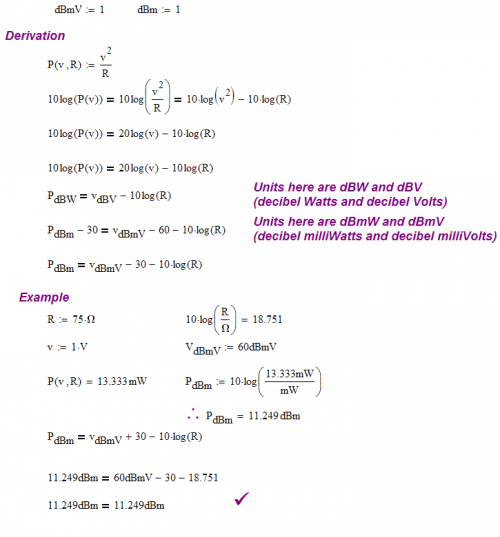
One of our young engineers asked me why all of us old-timers like to use logarithmic amplifiers when we need to measure input signal power. The answer is simple -- power expressed in dB is a linear function of the logarithm of the voltage. I must admit that the way electrical engineers use dB for everything sometimes makes things seem a bit confusing. In the cable TV market, we assume 75 Ω impedances and use dBmV (decibel millivolt) and dBmW (decibel milliWatt) for units. Anyway, here is a quick derivation and example.

Figure 1: Derivation of dB Relationship between Power an Voltage.

Figure 1: Derivation of dB Relationship between Power and Voltage.

Posted in Electronics | Comments Off on Measuring Power with A Logarithmic Amplifier

Learning How Electronic Parts Work

Introduction

A few years ago, I gave a lunch time talk on Mathcad to my hardware engineers. During the talk, one of the engineers mentioned that he starts a Mathcad worksheet when he is reading a part datasheet. While he is reading the datasheet, he works on developing a mathematical model of the part he is reading about. I had to smile – I do exactly the same thing.

We have a new design in progress and this design is using a device known a demodulating logarithmic amplifier (I will use the term log amp here). I have never used this device before, so I wanted to work my way through the datasheet. Our radio-frequency (RF) application is ideal for this type of device. I thought it would be useful to give you a glimpse at how I go about learning how a part works by using a Mathcad mathematical model.

Background

There are two general types of logarithmic amplifiers:

  • True Logarithmic Amplifier
    When analog designers think of a log amp, they think of these devices. These devices usually use the exponential characteristic of a semiconductor junction in a feedback loop to generate the logarithmic characteristic. While these circuits work well, they do not operate well at the high frequencies at which our designs must operate. The Wikipedia has a nice discussion of these devices and I will not pursue them here further.
  • Demodulating logarithmic amplifiers
    When an RF engineer thinks of a log amp, they think of these devices. They are known by a number of aliases:

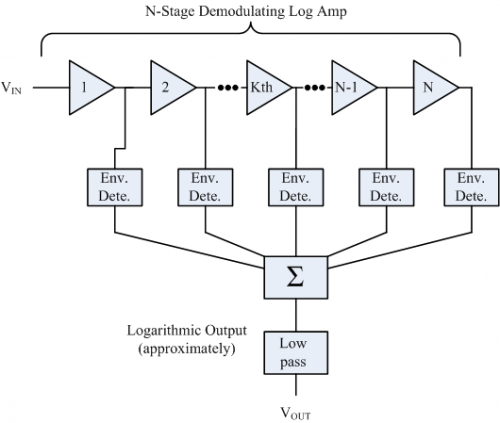
    These devices work by summing the outputs from a string of linear amplifiers hooked output to input. Just prior to summing , the amplifier outputs are passed through an envelope detector. This means that the demodulating log amps generate the logarithm of the envelope of the signal.

This post will focus entirely on the demodulating log amp approach. These are really the only option for a high-frequency application.

This Application

We have a classic application for a demodulating log amp:

  • large dynamic range (45 dB)
  • burst detection, which means that we need to detect the presence and measure the strength (level) of the RF signal.
  • circuit needs to be able to switch within 1 sec of the signal hitting our threshold level

For the work in this post, I will be using the Maxim 9933 RF-Detecting Control and RF Detector (yet another alias) as an example to motivate this discussion. This part represents the best of this technology available today. Here is a block diagram of this part.

Figure 1: Maxim 9933 Demodulating Log Amp Block Diagram.

Figure 1: Maxim 9933 Demodulating Log Amp Block Diagram.


My focus here is to explain how a chain of linear amplifiers can be used to generate a logarithmic transfer function.

Theory of Operation

Over the years, I have seen sets of amplifiers used to approximate many different functional relationships. For example, I have done a lot of work with a part designed by Javier Sanchez of Maxim (an analog guru) that uses three identical amplifiers to create a piecewise-linear approximation to a hyperbola (I will cover that little gem in a later post). The 9933 uses four amplifiers in series to create a piecewise-linear approximation to a logarithmic characteristic.

Functional Characteristic

Let's begin by defining what I mean by a logarithmic transfer function. Equation 1 shows the basic mathematical definition.

Eq. 1 {{V}_{Out}}={{V}_{0}}\cdot \log \left( \frac{{{V}_{In}}}{{{V}_{1}}} \right)

where

  • VOut is the output voltage from the log amp.
  • VIn is the input voltage to the log amp.
  • V0 is a gain constant which can be set during device calibration.
  • V1 is an input voltage scaling term, which is also set during calibration.

Demodulating Log Amp Block Diagram

I have googled the web and found at least four different approaches to using a series of amplifiers to approximate a logarithmic characteristic. Figure 2 illustrates the basic structure of the demodulating log amplifiers I have examined. All the implementation approaches have variations that make them different in the details, but they all generally function the same way.


Because these amplifiers are intended to detect power and signal envelopes, they include envelope detectors, summers, and low-pass filter. I will not discuss those circuit components because their implementation is straightforward and are covered in many places on the web (envelope detector, analog summer, low-pass filter). Most engineers will have knowledge of electronic circuits anyway as it is one of the main aspects of their job. Circuits are essential to powering most electrical devices, so it's vital that engineers do understand each different type of circuit. Most circuits are usually assembled by professional companies. Perhaps anyone looking for a custom-built electronic circuit could consider visiting the international sensors website to learn more about their services. Hopefully, this will lessen the need for an engineer to fix the circuit as the parts will have been professionally made.

Figure 2: Generic Demodulating Log Amp Block Diagram.

Figure 2: Generic Demodulating Log Amp Block Diagram.

Normally, amplifiers can be modeled as functions that multiply the input signal (current or voltage) by a fixed number. For my modeling here, I am assuming that the amplifiers within the log amp also multiply their input signals by a fixed number (called gain) but that also have output levels that will not exceed a specific voltage, which I call VLimit. Figure 3 illustrates the voltage output versus input transfer function. For this discussion, I will refer to the amplifiers within the log amp as limit amps.

Figure 3: Idealized Limit Amplifier Characteristics

Figure 3: Idealized Limit Amplifier Characteristics

Let's first try to understand qualitatively how the amplifier works. Assume we are going to apply a steadily increasing voltage from 0 to the point where all the amplifiers are limiting. At very low input voltages, no amplifiers are limiting and the gain of the system is the product of all the amplifier gains. As the input voltage increases, the last amplifier in the chain limits and the total gain of the system now reduces by the gain of that amplifier. As the input voltage continues to increase, the amplifiers limit one by one and the overall system gain reduces. When all the amplifiers have limited the gain of the system is 0. Figure 4 shows how limit amps can be connected in series to create a piecewise-linear approximation to the logarithm function (Equation 1).

Figure 4: Logarithmic Amplifier As Piecewise-Linear Approximation.

Figure 4: Logarithmic Amplifier As Piecewise-Linear Approximation.


In Figure 4, I assume that the first amplifier has a gain of m?1. Generally, engineers would make all the amplifiers identical and simply attenuate the output of the first amplifier. This is an approach used by some logarithmic amplifiers and it makes for a simple derivation of logarithmic performance (shown below). There are other approaches, but I will only cover the system shown in Figure 4.

Modeling in Mathcad

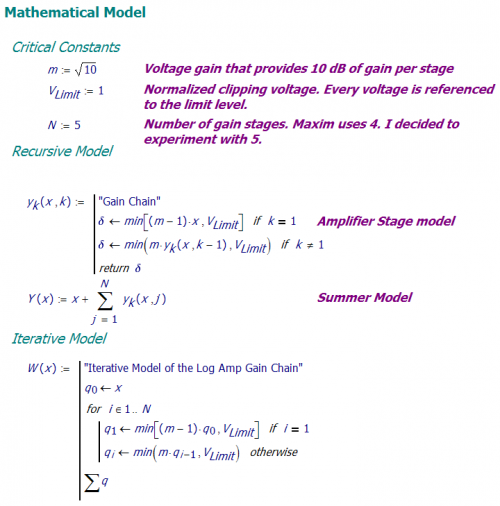
Figure 5 shows the two models that I generated, one recursive and the other iterative. They are very similar and show how easily Mathcad models this type of circuit.

Figure 5: Iterative and Recursive Log Amp Models in Mathcad.

Figure 5: Iterative and Recursive Log Amp Models in Mathcad.


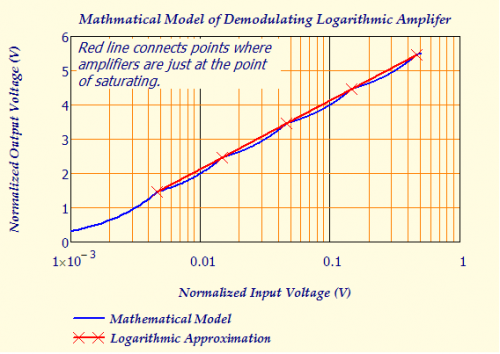
Both models produce the same answer. I did two models just to demonstrate equivalent, but different, approaches. Figure 6 shows the output from the model. It is very similar to the same graph published for the 9933.

While I model the amplifiers as having a "hard" clipping characteristic, real amplifiers have a "softer" clipping characteristic. It turns out that this "softer" clipping actually improves the circuit's conformance to a logarithm function (I will not go into detail here). It is not often in engineering where the non-ideal characteristics of a component actually make an engineer's job easier, but this is one case.

Derivation

As shown in Figure 4, assume each of the amplifiers are labeled from left to right with numbers from 1 to N. Note how all but the first amplifier have gains of m. The first amplifier has a gain of m-1. Figure 4 shows the piecewise-linear approximation. The slope of the characteristic changes each time an amplifier saturates. We can compute the input voltage at which the kth amplifier saturates as shown in Equation 1.

Eq. 2 {{V}_{T,k}}\cdot \left( m-1 \right)\cdot {{m}^{k-1}}=1\quad \Rightarrow \quad {{V}_{T,k}}=\frac{1}{\left( m-1 \right)\cdot {{m}^{k-1}}}

where VT,k is the input threshold voltage at which the kth amplifier saturates.

We can compute the output voltage of the amplifier chain when the kth amplifier is saturated. If m>1, every amplifier after the kth will also be saturated. Equation 3 shows the details of the derivation. During the derivation, I normalize all the voltages to the value of the limit voltage, VLimit. Equation 3 shows the output voltage at the points where the amplifiers just reach VLimit ( VIn = VT,k).

Eq. 3 {{V}_{Out}}={{V}_{In}}\cdot \left( 1+\left( m-1 \right)+\cdots +\left( m-1 \right)\cdot {{m}^{k-2}} \right)+{{V}_{Limit}}\cdot \left( N-k+1 \right)
Define {{V}_{On}}\triangleq \frac{{{V}_{Out}}}{{{V}_{Limit}}} and V_{In} \triangleq \frac{V_{In}}{V_{Limit}}.
{{V}_{On}}={{V}_{In}}\cdot \left( 1+m+\cdots +{{m}^{k-1}}-\left( 1+m+\cdots +{{m}^{k-2}} \right) \right)+N-k+1
{{\left. {{V}_{On}} \right|}_{{{V}_{In}}={{V}_{T,k}}}}=\frac{{{m}^{k-1}}}{\left( m-1 \right)\cdot {{m}^{k-1}}}+N-k+1
\therefore {{\left. {{V}_{On}} \right|}_{{{V}_{In}}={{V}_{T,k}}}}=\frac{1}{m-1}+N-k+1

To show that Equation 3 describes a logarithmic characteristic, we can solve Equation 2 for k and substitute that expression into Equation 3. Equation 4 shows how Equation 2 can be solved for k.

Eq. 4 {{m}^{k-1}}=\frac{1}{\left( m-1 \right)\cdot {{V}_{T,k}}}\quad \Rightarrow \quad k=-\frac{\log \left( \left( m-1 \right)\cdot {{V}_{T,k}} \right)}{\log \left( m \right)}+1

We can substitute Equation 4 into Equation 3 to obtain Equation 5.

Eq. 5 {{V}_{On}}=\frac{1}{\left( m-1 \right)}+N+\frac{\log \left( \left( m-1 \right)\cdot {{V}_{T,k}} \right)}{\quad \log \left( m \right)\quad }
{{V}_{On}}=\underbrace{\frac{1}{\left( m-1 \right)}+N+\frac{\log \left( m-1 \right)}{\quad \log \left( m \right)\quad }}_{\text{Constant}}+\underbrace{\frac{1}{\log \left( m \right)}}_{\text{Slope}}\cdot \log \left( {{V}_{T,k}} \right)

Equation 5 shows the input voltages at which each limit amplifier begins to limit. These are the input voltages at which the output voltage will exactly match the logarithm function. Note that the actual characteristic will deviate from that of a logarithm at input voltages that are not at the limit points.

Figure 6 shows a plot of my Mathcad model for the actual characteristic and the logarithmic curve that the limit points pass through.

Figure 6: Idealized Logarithm Function and Mathematical Model Output.

Figure 6: Idealized Logarithm Function and Mathematical Model Output.
A straight line on a semi-log plot means the function is logarithmic.

Conclusion

I thought this was a good example to illustrate how a computer algebra system can be used by an engineer to develop insight into how the parts he is using work. I use this approach all the time. I will try to publish a few more of these analyses if people find them interesting.


(see part 2 for some further details)

Posted in Electronics | 2 Comments

Bad Business Decisions

During a hallway discussion, the topic of bad business decisions came up. Everyone knows that a business can make a bad decision if they don't consider the facts and look at the statistics for every decision. It's no surprise that things like statmodeling is getting advanced when it comes to helping businesses with decision making, as this is an important part of a business's success. Not every business bothers with this though, so when I was asked to relate the dumbest business decision that I had ever seen, it was very easy for me to tell my story. Because I do not wish to receive hate mail, I will not mention the name of the company who made this decision. Let's call them Brand X.

The story starts five years ago when the fiber-to-the-home business was still in its infancy. Today, millions of units per year of fiber-to-the-home products are being shipped, but back then maybe 100K per year were being shipped worldwide. There is a part that is used on most of these units. Brand X is a company a few blocks from where I work and they made an excellent version of this part. Unfortunately, they are focused on shipping to the military and aerospace market and my firm is commercial. I went over to their facility and had a discussion with them about their part and I ended up using their part in our design. The part was a little clunky in a commercial application because military RF systems typically operate at 50 and fiber-to-the-home systems run at 75. I told the management of Brand X that I will use their part for now, but that I need them to eventually make a 75 version of the part. Their engineers told me that the change was minor and could be done by one person over a couple of months. We agreed on a unit price of $5.

I ended up buying large numbers of Brand X parts, but eventually, I really needed to get a 75 version of this part. I made another trip over to Brand X and asked them again to make a 75 version of this part. Their response was interesting. They wanted me to pay $50K to cover their R&D costs. I was buying about $50K worth of product every few months at that point. I told them that I would not cover their R&D costs. Besides my volume, they could sell millions of units to other people in the fiber-to-the-home space besides me. I could easily go to other companies who would make the part for me with no up-front costs. The local company told me that their system was focused on the military and aerospace markets where R&D costs are paid for by the customers. Their system could not deal with investing money in order to make more money. I was floored.

After thinking about it for a long time, I still couldn't wrap my head around it. Isn't taking risks a big part of running a business? You may not achieve as much growth as you'd like to see if you abide by the rules all the time. My friend is all about investing money, and he tries absolutely anything and everything he can to make as much income as possible. So much so, he's even decided to look at how these best investment apps uk may be able to help him to earn more going forward, as he wants to be able to see some growth with his own personal finance. Good for him! That's why I struggle to come to terms with the fact that businesses, particularly this one, don't take a similar sort of route. I just want to be able to put some money into my Self Managed Super Funds account! I'm not the best when it comes to savings but I thought this business venture would help me due to the extra income involved. I guess it's a bit more slow-moving than I originally thought!

To make a long story short, I discussed this with the Brand X management numerous times and they insisted that they could not make the change without up-front money. I ended up talking to several brands, including WG Henschen and an Australian company who developed a 75 Ω version of the part for nothing and I ended up using their part. I dropped Brand X and will never use them again. This particular part has now become standard in the industry and millions of these units are now used every year in the fiber-to-the-home market. My company alone purchases over 100K units per year. The local firm continues to make small quantities for the military market. The best thing for their company and the local community would have been to make this simple change, but they could not see further than their current market. I hope that I never develop that level of nearsightedness.

Posted in Management | Comments Off on Bad Business Decisions

Air Conditioning Math

Introduction

I get some strange phone calls. I recently received one from a customer who wanted to know how many "tons of air conditioning" he needed to cool some equipment he had purchased from my company. All air conditioning units are different whether you get one from air conditioning Spokane or myself, but they should all work very similarly. After I assisted this customer with his problem, he asked me if I knew where this strange unit came from. Here is the story I told him.

Background

This unit of air conditioning is a real fossil. It goes back to the first days of the air conditioning/refrigeration industry. However, there now companies that provide heating, plumbing and air conditioning services. The ton came into use by the refrigeration industry because early refrigerators were used to make ice. The ton represents the amount of cooling capacity needed to make 1 ton of ice per day. In the US, home air conditioners are usually rated in BTUs/hour, and commercial refrigeration units are usually rated in terms of tons of ice frozen per day. If you need your refrigeration unit looked at then, Lake Country Repair services commercial refrigerators and freezers in the Milwaukee area, if you are not in that area, do local research and check out listings for a repair service closer to you.

The temperature of liquid water reduces by roughly 1C for every calorie per gram. When liquid water is at 0C and you continue to extract heat, water begins to undergo a phase transition from liquid to ice. The energy required to make this transition is referred to as heat of fusion (symbol ?Hm). The heat of fusion for water is 79.72 cal/g.

We can compute the energy required for one ton of water to transition from liquid to ice as shown in Equation 1.

Eq. 1 E=left( frac{1text{ ton}}{text{day}} right)cdot left( frac{2000text{ lb}}{1text{ ton}} right)cdot left( frac{1000text{ g}}{2.20text{ lb}} right)cdot left( frac{79.72text{ cal}}{text{g}} right)=3.03text{E8 }frac{text{J}}{text{day}}text{ = 287000 }frac{text{BTU}}{text{day}}

We usually say that 12000 BTUs per hour equals 1 ton of refrigeration per day. Equation 2 illustrates this calculation.

Eq. 2 frac{1text{ ton}}{text{day}}text{=287000}frac{text{BTU}}{text{day}}cdot frac{1text{ day}}{24text{ hour}}=11958frac{text{BTU}}{text{hr}}

Conclusion

I must admit that I find the units of measure used in the US confusing. I wish things were different, but I am a realist. All I can do is try to shed some light on the subject. If you're more interested in just cooling your room down rather than running calculations, check out the Coolest Gadgets review of various portable air conditioners that will do the job.

Posted in Construction, History of Science and Technology | 1 Comment

Oxygen on Earth

Quote of the Day

In order to write about life, first you must live it.

— Ernest Hemingway


Introduction

Figure 1: Stromatolites in Shark Bay, Australia (Source:Wikipedia).

Figure 1: Stromatolites in Shark Bay, Australia (Source:Wikipedia).

As my regular readers can tell, I do not passively sit and watch television. While I am watching a program (history or science-oriented, nothing else), I have my computer right there and I actively research what is being said during the program. Last weekend, I was watching an interesting program on the History channel called "How the Earth was Made". This particular program was about the formation of the Earth and it contained an excellent section on the generation of atmospheric oxygen (transcript of program). In my opinion, the star of the show was a little rocky structure called a stromatolite (Figure 1). A stromatolite is a layered, rock-like structure formed when shallow-water sediments are trapped in films of microorganisms.

Stromatolites can get quite large, such as this two-ton one reported here.

What piqued my mathematical interest was the following statement.

Over a period of 2 billion years, countless generations of stromatolites pumped out over 20 million billion tons of oxygen.

I was wondering if I could gain some additional insight into this number. In the main body of this post, I will look at how much oxygen is in our atmosphere today. In the appendix, I will examine how to estimate the total amount of oxygen over time that has been released on Earth. These will be rough order of magnitude calculations. Let's dig in ...

Analysis

Earth's Atmosphere and Oxygen

Initially, the Earth's atmosphere had very little oxygen (~25 million times less than today) – then came the "Great Oxidation Event", which started some 2.3 billion years ago. During this time, atmospheric oxygen levels rose dramatically. The oxygen was being pumped out by organisms like stromatolites. We know that this oxygen ended up in places other than the atmosphere. For example, I live in Minnesota where iron oxide is all over the northern half of the state – the amounts are staggering. There are also large amounts of oxygen dissolved in the ocean and embedded in the crust. This article discusses three mechanisms for incorporating atmospheric oxygen in the crust.

  • iron reacting with oxygen-rich seawater and precipitating out.
  • oxygen-rich water in seafloor sediments drawn into the crust.
  • oxygen-rich sulfates in undersea hot springs reacted with iron in seafloor sediments.

How Much Oxygen is in the Atmosphere Today?

We live at the bottom of a sea of air. When we measure air pressure, we are really measuring the weight of the mass of air above that point. We can roughly calculate the mass of atmosphere by multiplying the air pressure times the area that pressure covers. We will break the Earth up into two parts: land and ocean.

We need to collect a few facts before we start our analysis.

  • 20.95% oxygen by volume (Source - dry air value, I am ignoring water vapor)
  • 70.8% of the Earth's surface is covered by water, 29.2% by land (Source)
  • The mean radius of the Earth is 6,371.0 km (Source)
  • The mean air pressure at sea level is 101.325 kP or 14.7 psi (Source)
  • The mean elevation of the continents is 840 meters (Source).
  • The mean air pressure at 840 meters is 91.633 kP or 13.3 psi (Source - equation used in Fig. 2)

With these facts in mind, it is now time to pull out the mathematical artillery (i.e. Mathcad).

Percentage of Oxygen By Mass

For ideal gases, the volume fraction and mole fractions are equal. The real atmosphere is not ideal, so let's go and compute the percentage of oxygen in the atmosphere by mass. To perform this calculation, we can use the gas composition of the atmosphere by volume and the molecular weights of these gases to compute the percentage of oxygen by mass. Equation 1 illustrates the calculation.

Eq. 1 p\%m=\frac{{{V}_{Oxygen}}\cdot M{{W}_{Oxygen}}}{\sum\limits_{i=1}^{N}{{{V}_{Ga{{s}_{i}}}}\cdot M{{W}_{Ga{{s}_{i}}}}}}

I used a table from the Wikipedia and did the Equation 1 calculation as illustrated in Figure 2.

Figure 2: Calculating the Percentage of Oxygen in the Atmosphere by Mass.

Figure 2: Calculating the Percentage of Oxygen in the Atmosphere by Mass.

Mass of Oxygen in the Atmosphere

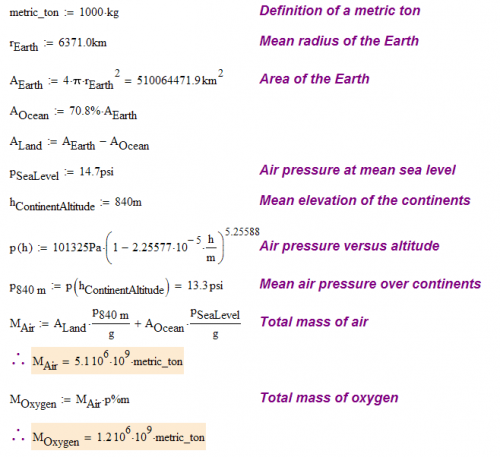
Figure 3 shows the calculation for the total mass of oxygen in today's atmosphere.

Figure 3: Calculating the Mass of Oxygen in the Atmosphere.

Figure 3: Calculating the Mass of Oxygen in the Atmosphere.

Conclusion

Let's see if I can check my answers. According to the National Center for Atmospheric Research, the total mass of the Earth's atmosphere is 5.1353·1015 metric tons. So I have good agreement there. My estimate for the mass fraction of oxygen in the Earth's atmosphere (23.1%) equals that stated in the Wikipedia, so I am good there. My estimate for the total mass of O2 in the atmosphere is 1.2 million billion metric tons, which agrees with this reference. So overall the analysis is pretty close.

The stromatolites alone produced 20 million billion tons (possibly more, see Appendix). The majority of the oxygen produced by stromatolites has apparently gone somewhere other than the atmosphere. In fact, there are enormous amounts of atmospheric oxygen that ended up chemically tied up in rocks. Consider the following quote (Source).

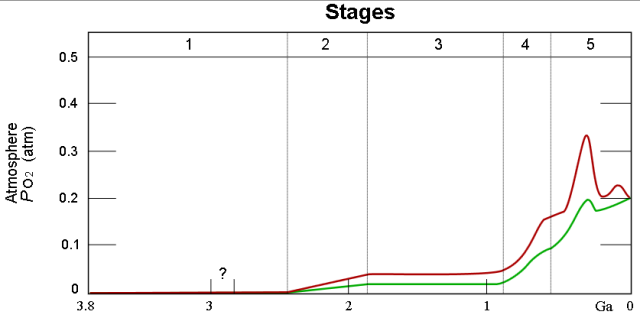
While photosynthetic life reduced the carbon dioxide content of the atmosphere, it also started to produce oxygen. For a long time, the oxygen produced did not build up in the atmosphere, since it was taken up by rocks, as recorded in Banded Iron Formations (BIFs) and continental red beds. To this day, the majority of oxygen produced over time is locked up in the ancient "banded rock" and "red bed" formations. It was not until probably only 1 billion years ago that the reservoirs of oxidizable rock became saturated and the free oxygen stayed in the air.

Figure 4 is from the Wikipedia and does a nice job illustrating the Earth's O2 level over time. The red and green lines illustrate the range of estimates for the percentage of O2.

Figure 4:Earth's Atmospheric Oxygen Percentage Versus Time.

Figure 4: Earth's Atmospheric Oxygen Percentage Versus Time.

There are some folks that claim the high oxygen levels in the past may have played a role in making dinosaurs so large.

Appendix A: Interesting Quote on Stromatolite-Produced Oxygen

Figure 5 shows where the photosynthesized oxygen went (Source). Note that this reference assumes that the total amount of photosynthesized mass of O2 on Earth is 3x10²² grams (=30 million billion metric tons). Clearly, estimates for the amount of photosynthesized O2 vary a bit.

Figure 5: Cumulative History of O2 by Photosynthesis Through Geologic Time.

Figure 5: Cumulative History of O2 by Photosynthesis Through Geologic Time.

The following quote (source) describes how most of the oxygen was chemically bound to the Earth and the rest was released to the air.

A sort of mass balance for atmospheric oxygen (including that dissolved in the sea) is shown in Figure 13.8 [my Figure 5]. The excess oxygen depends on a corresponding accumulation of organic matter (plus biologically reduced sulphur and methane) that has become buried in sedimentary deposits. About 58% and 38% of this oxygen has been used for the oxidation of iron and sulphur, respectively during the 3.5 - 3.8 billion years of organic photosynthesis. The remaining 4% (about 1.2x10¹⁵ tonnes) is found as free O2. The turnover rate of this atmospheric oxygen is only about 4000 years and is caused by organic photosynthesis and respiration processes that almost balance so that the biological turnover is vastly faster than the slow accumulation of organic matter. Given the crude estimates in Figure 13.5. there is altogether an excess of 3x10¹⁶ tonnes of oxygen (of which the greater part is in the form of oxidized iron and sulphur and only 4% as O2). Over roughly four billion years this corresponds to a net accumulation of 7.7x10⁶ tonnes per year. The annual turnover due to photosynthesis and respiration corresponds to (1.2x10¹⁵[tonnes])/4000 [years] = 3x10¹⁰[11] tonnes O2 per year; that is production and respiration is about 20,000[36,500] times faster than the slow accumulation of organic matter in sedimentary rocks. This calculation, of course, assumes that both the production rate and the rate of accumulation of un-mineralized organic matter have been constant over geological time. Some evidence indicates that this has been the case since roughly the second half of the Precambrian.

As you can see from the quote, the calculation of total O2 production over the history of the Earth requires a number of assumptions.

I have noticed some minor math errors (see highlights) in the quote given above – minor in the sense that they do not change the result qualitatively, but I do see some calculation issues. Figure 6 shows my version of the calculations using the data given above. In the calculation, I assume that the period of organic photosynthesis was 3.65 billion years (the mean of the range given in the quote).

Detailed Calculation Using Given Data.

Figure 6: Detailed Calculation Using Given Data.

Save

Posted in General Science, History of Science and Technology | 15 Comments

Star Trek Analogies to Engineering Management

It amazes me how often my management experiences remind me of Star Trek episodes. A good example came up today. At extremely regular intervals, I must prepare budget reports that document the spending of my department. If I am late, I receive emails that progressively get nastier until I feed the accounting monster. While preparing this budget report today, one of my senior engineers asked me what I was doing. I told him that I was feeding Vaal. For the uninitiated, Vaal is a machine from Star Trek that a group of primitive people were obligated to bring food to every day. A loud bong is struck when Vaal needs to be fed. When Vaal was denied food for any significant length of time, he got really nasty (e.g. generated storms, threw lightning bolts, etc). The analogy is just too good.

Figure 1: Vaal from Star Trek. Its behavior is similar to that of my budget minders.

Figure 1: Vaal from Star Trek. Its behavior is similar to that of my budget minders.

Posted in Management | 1 Comment

Battery State of Charge

Introduction

Nearly all of our products are sold with an Uninterruptable Power Supply (UPS) because customers need phone service for emergency voice calls, which we refer to as "lifeline service". Batteries are used for energy storage in all of our UPS hardware we sell. I do not know a single engineer who regularly deals with batteries that likes them. They are the biggest pain I deal with. Here is my summary of complaints:

  • They are expensive.
    Batteries often contain materials that are very expensive. Battery cost is strongly affected by commodity prices. It was not long ago that a commodity price bubble caused me great pain as I tried to keep my unit product cost down.
  • They require replacement at regular intervals (every 3 to 5 years) to ensure they work when needed
  • There are always safety issues to address
    Look at the history of Li-ion batteries and their tendency to catch fire. Many battery chemistries emit explosive gases (e.g. lead-acid batteries emit hydrogen when being charged).
  • They often contain materials that are expensive to dispose of.
    Batteries often contain materials like lead (e.g. lead-acid batteries) or cadmium (eg. Nicad batteries). These are poisonous elements that are expensive to dispose of safely.
  • Charging is often a complicated operation.
  • Battery performance is strongly temperature dependent.

Our UPS vendor has a "low battery" alarm that supposedly tells the customer when the battery capacity has been reduced to 20% of its rating. This is an extremely deceptive alarm. I have spent much time trying to accurately predict remaining battery capacity and have not been totally successful. This is a complicated question because a battery is a chemical beast that is subject to temperature and aging effects that make accurate prediction of it remaining capacity difficult.

Today, our customer service group asked me to explain what "20% capacity remaining" really means. All I could do was sigh and give the following answer.

Analysis

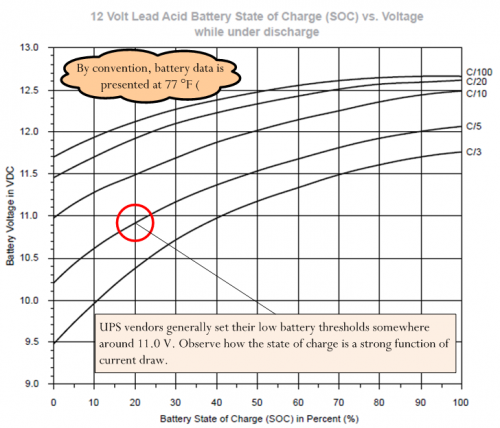
Most UPS hardware tries to estimate their battery's state of charge by measuring the battery terminal voltage. Figure 1 shows the terminal voltage versus state of charge voltage for a 6-cell, 12 V lead-acid battery.

Figure 1: Battery Terminal Voltage (V) Versus State of Charge (%).

Figure 1: Battery Terminal Voltage (V) Versus State of Charge (%).


People unfamiliar with batteries see that there are multiple curves that are labeled with things like "C/100" or "C/3". These curves represent the current load the battery is under load. The ratio "C/T" represents represents the capacity of the battery in amp-hours (C) and the discharge time (T).

Eq. 1 I_{Discharge}=\frac{C}{T_{Discharge}}

where C is the battery capacity in amp-hours and TDischarge is the discharge time.

The UPS we use has its low battery alarm set to activate when the terminal voltage drops below 11.0 V. However, an 11.0 V terminal voltage only represents 20% capacity when the battery load is C/5. In my application, the load is C/10. This means that in my application the low battery alarms is asserted when the battery is almost completely discharged. This has caused some issues for customers who want to depend on that last 20%. Unfortunately, they cannot depend on that battery having any capacity left when the low battery alarm is activated.

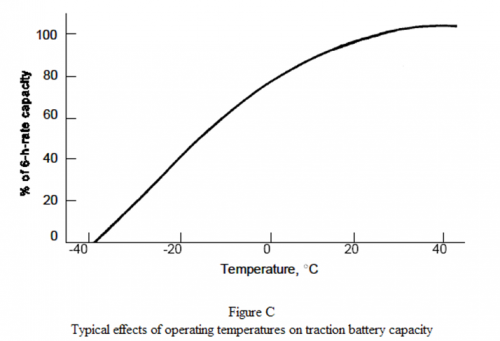
Temperature also complicates the situation. Everything I have said above assumes a temperature of 77 °F (25 °C). Battery capacity depends strongly on temperature, which is shown by Figure 2.

Figure 2: Battery Capacity Variation with Temperature.

Figure 2: Battery Capacity Variation with Temperature.


If your UPS is at a temperature other than 77 °F, you will need to compensate for the temperature variation.

Battery capacity is also a function of the age and charging history of the battery. Older batteries do not have as much capacity as new batteries because of corrosion effects. Batteries that have been through many charge and discharge cycles have less capacity than new batteries because battery capacity degrades with each discharge/charge cycle.

Conclusion

Accurately predicting reserve battery capacity is a complicated thing. I try to avoid it whenever I can.

Posted in Batteries, Electronics | Comments Off on Battery State of Charge