Computing the Age of the Universe

Introduction

While in the lunch room at work, I often look at the paper. The paper one day this week had an article on the farthest object that has yet been observed by astronomers. One of the guys in my group was there and we started to talk about computing the Earth's age and computing the age of the universe. Since I have already covered calculating the age of the Earth in a previous post, I thought it would be worth documenting calculating the age of the universe as well. It is a shorter subject, at least for this level of detail.

Calculation

The only piece of data needed is Hubble's constant. We can see the linear relationship between the recessional velocity and distance from the chart shown in Figure 1 (Source). Note the linearity of the characteristic.

Figure 1: Recessional Velocity Versus Distance.

Figure 1: Recessional Velocity Versus Distance.
I believe the bulge in the middle of the curve is the data from various galaxy clusters (e.g. Virgo), which also have a rotational component to their motion.


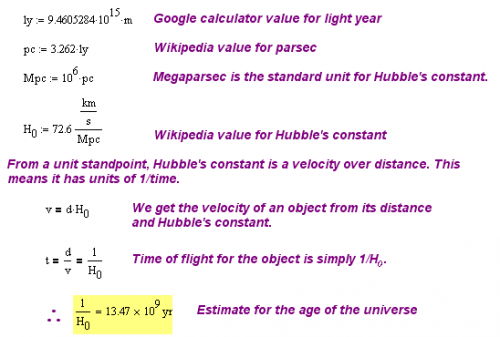
I show in Figure 2 that the reciprocal of Hubble's constant equals the age of the universe. Figure 2 is a screenshot of my Mathcad worksheet (I like to use Mathcad's unit checking).
Figure 2: Calculation of the Age of the Universe.

Figure 2: Calculation of the Age of the Universe.

Conclusion

Pretty straightforward. I first got interested in the subject while listening to an audio book called "Horizons of Cosmology" by Silk. It is a great listen and worth your time if you are interested in that sort of thing.

Posted in Astronomy | 2 Comments

Modeling Drag — Projectile Velocity Versus Range

Introduction

As mentioned in a previous post, I am reading the book "Modern Practical Ballistics" by Pejsa. I have been working through some of the derivations in the book and they are interesting enough (at least to me) to be worth documenting here. One of these interesting derivations is an elegant result for the variation in projectile velocity versus range. Since all cartridge documentation include tables of velocity versus range, I have a wealth of data to compare to the equation's output. I love it when I can compare a model to lots of real data. Let's dig in …

Drag Coefficient

A projectile moving through air experiences drag. The force of drag slows the projectile and causes velocity to fall of as the projectile travels on it course. The Wikipedia contains a very good discussion of drag and I refer you to that article for greater details. However, I will review the relevant points to my discussion here quickly.

  • Drag refers to forces that oppose the relative motion of an object through a fluid (a liquid or gas).
  • Drag forces act in a direction opposite to the oncoming flow velocity. This means that there will be some minus signs in upcoming equations.
  • Drag forces depend on velocity.
  • For the purposes of this blog, I will be focusing on the drag a bullet experiences above the speed of sound. This is considered high velocity. There are ways to model drag at other velocities, but that is not my goal here.

The force that drag exerts on a bullet is given by the drag equation (Equation 1).

Eq. 1 {{F}_{d}}=\tfrac{1}{2} \cdot \rho \cdot {{v}^{2}}\cdot{c_d} \cdot A

where

  • Fd is the force of drag, which is by definition the force component in the direction of the flow velocity
  • ρ is the mass density of the fluid
  • v is the velocity of the object relative to the fluid
  • A is the reference area
  • cd is the drag coefficient

Understanding the drag coefficient cd is the most important part of this discussion. Equation 2 contains the definition of the drag coefficient.

Eq. 2 c_d=\frac{F_d}{\frac{1}{2}\cdot \rho \cdot {{v}^{2}}\cdot A}

We need to make some observations about the drag coefficient.

  • Below the speed of sound, the force of drag increases with the square of velocity.
  • This means the drag coefficient is constant for velocities less than the speed of sound.
  • Above the speed the speed of sound, the force of drag does not follow a square law.
  • Therefore, the drag coefficient is NOT a constant in the transonic and supersonic regions.

Figure 1 shows an example of the drag coefficient for the standard reference bullet, usually referred to as the G7 shape (see Figure 2).
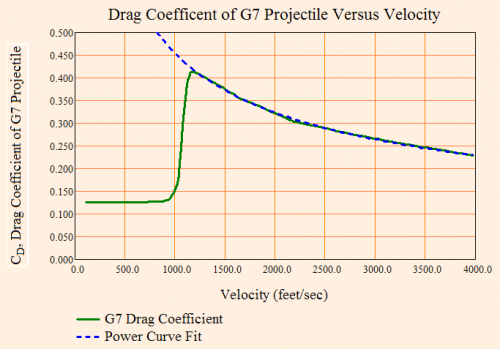
Figure 1: Drag Coefficient Plot (Green Line) for a G7 Standard Projectile.

Figure 1: Drag Coefficient Plot (Green Line) for a G7 Standard Projectile.

Note that Figure 1 also shows a blue line that demonstrates that the drag coefficient can be well approximated for velocities above the speed of sound (~1,126 ft/s feet per second) by an equation of the form k_d \cdot {{v}^{-n}}, where kd and n are projectile-specific constants.

Figure 2: G7 Reference Projectile (Similar to Spitzer Design).

Figure 2: G7 Reference Projectile (Similar to Spitzer Design).

For the derivation to follow, I will use Equation 3 to model the variation in cd with velocity.

Eq. 3 c_d={k_d}\cdot {{v}^{-n}}

I will use Equation 4 to model the deceleration of the projectile with respect to velocity.

Eq. 4 {{a}_{d}}=-\frac{{{F}_{d}}}{m}=-\left( \frac{\frac{1}{2}\cdot \rho \cdot A}{m} \right)\cdot \left( {{k}_{d}}\cdot {{v}^{-n}} \right)\cdot {{v}^{2}}=-k\cdot {{v}^{2-n}}

where m is the mass of the projectile and k is a generic constant I will use to aggregate all the projectile and atmospheric parameters (k\triangleq \frac{{{k}_{d}}\cdot \rho \cdot A}{2\cdot m}).

Derivation of Velocity Versus Range Equation

We can use the expression for the acceleration of the projectile (Equation 4), we can construct and solve a differential equation that relates velocity and position. Equation 5 shows the desired differential equation and how to solve it. This equation assumes that the projectile is moving horizontally, which is what Pejsa assumed. For bullets used in normal applications (e.g. target shooting, hunting), this is a good assumption for velocity. It is not a good assumption for bullet drop, which I will handle in a later post.

Eq. 5 \frac{{{d}^{2}}x}{d{{t}^{2}}}=\frac{dv}{dt}=-k\cdot {{v}^{2-n}}
\frac{dv}{dx}\cdot \frac{dx}{dt}=-k\cdot {{v}^{2-n}}
\frac{dv}{dx}\cdot v =-k\cdot {{v}^{2-n}}
{{v}^{n-1}}\cdot dv=-k\cdot dx
\int\limits_{{{v}_{0}}}^{v}{{{v}^{n-1}}\cdot dv}=-\int\limits_{0}^{x}{k\cdot dx}
\frac{{{v}^{n}}}{n}-\frac{v_{0}^{n}}{n}=-k\cdot x
\therefore {{v}^{n}}=v_{0}^{n}\cdot \left( 1-n\cdot k\cdot x\cdot v_{0}^{-n} \right)

At this point, Pejsa introduces an interesting substitution. He defines a term F, which he calls the retardation coefficient. F provides a computationally simple yet accurate drag model (see this post for more information).

Eq. 6 F\triangleq \frac{1}{k\cdot {{v}^{-n}}} and {{F}_{0}}\triangleq \frac{1}{k\cdot {{v}_{0}}^{-n}}

We can substitute Equation 6 into Equation 5 to obtain Equation 7.

Eq. 7 {{v}^{n}}=v_{0}^{n}\cdot \left( 1-\frac{n\cdot x}{F_0} \right)

We can substitute Equation 6 into Equation 7 to derive a simple relationship between F and F0, which is shown in Equation 8.

Eq. 8 F\cdot k={{F}_{0}}\cdot k-k\cdot n\cdot x \Rightarrow F={{F}_{0}}-n\cdot x

Equation 7 allows us to compute the projectile velocity versus range, given values for F and n. In a later blog post, I will show how F and n can be estimated for standard projectiles.

Empirical Comparison

It is interesting to look at a real projectile and see how well this model fits the empirical data. Consider a Hornady 308 caliber, 150 grain, SST-LM. Figure 3 shows the data in a screen capture from Mathcad.

Figure 3: Velocity Versus Range Data for Hornady 308, 150 Grain, SST-LM

Figure 3: Velocity Versus Range Data for Hornady 308, 150 Grain, SST-LM

Using Mathcad, I fit the projectile velocity data to Equation 7 (n = 0.266 and F0 = 1227 yards) and plotted the fitted curve and the raw data in Figure 4.
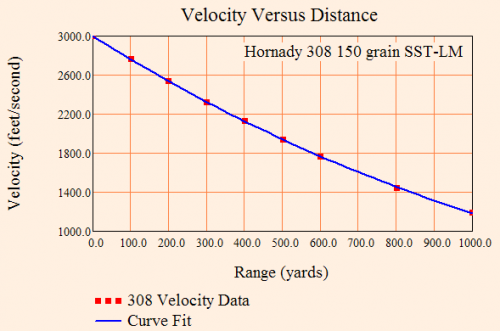
Figure 4: Raw Hornady Data and Model Curve Fit Comparison.

Figure 4: Raw Hornady Data and Model Curve Fit Comparison.
Raw data from Ammo and Ballistics II (2nd Edition) by Forker (ISBN 1-57157-305-4).

The fit is excellent.

Conclusion

I presented a summary of the Pejsa derivation for the velocity of a projectile versus distance. The agreement between his equation and an arbitrarily chosen example was excellent. In subsequent posts, I will discuss other results from his model.

Posted in Ballistics | 40 Comments

Ogives Versus Other Shapes

The ogive has long been used in projectile design because it simple to manufacture. Over the last few thousand years, people have gotten pretty good at making sections of spheres. However, simple to manufacture does not mean minimum drag. The Wikipedia has a great figure that really does a nice job of summarizing the performance of the ogive relative to other shapes.

Figure 1: Drag Comparison of Different Aerodynamic Shapes.

Figure 1: Drag Comparison of Different Aerodynamic Shapes.

Source:Comparison of drag characteristics of various nose cone shapes in the transonic to low-mach regions. Rankings are: superior (1), good (2), fair (3), inferior (4).

Comparisons are for projectiles of a given length and width. Observe that the ogive is in the inferior category. However, it is still commonly used for projectiles. Ballistics has a long history and change comes slowly.

Posted in Ballistics | 1 Comment

Ogives and Battleships

Introduction

The previous two blogs looked at the ogive shape and its use in describing bullet shapes. While cruising around the web, I noticed a rather large ogive shape that I thought was interesting. I am a big fan of anything having to do with battleships, and the 16-inch projectiles fired by the Iowa-class battleships are an excellent example of a large ballistic ogive. They have an ogive radius of 9 calibers (i.e. 144 inches/ 16 inches = 9 caliber). For those interested in a modern discussion of these projectiles and how to improve them, I suggest this forum discussion.

Background

During WWII, the Iowa-class ships fired two types of projectiles:

  • Mk 13 HC (High Capacity)
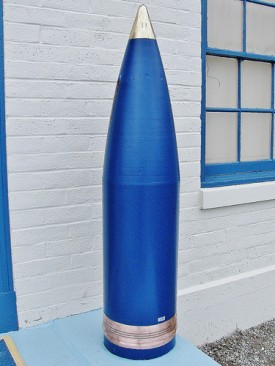
    A shell designed to carry the maximum amount of explosive. It was used for shore bombardment against "soft" targets. It weighed 1900 lbs. It is shown in Figure 1.
  • Mk 8 AP (Armor Piercing)
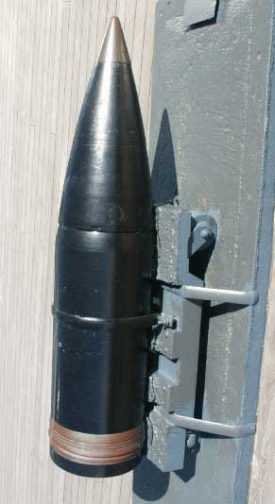
    This projectile is designed to destroy structures made of reinforced concrete or armored ships, like other battleships. This projectile weighed 2700 lbs. It is shown in Figure 2.

Figure 1: Mk 13 HC (High Capacity) 16-inch Shells.

Figure 1: Mk 13 HC (High Capacity) 16-inch Shells.

Figure 2: Mk 8 AP (Armor Piercing), 16 inch Shell (Rotated Horizontal Photo)

Figure 2: Mk 8 AP (Armor Piercing), 16 inch Shell (Rotated Horizontal Photo)

Source Source

Basic Construction

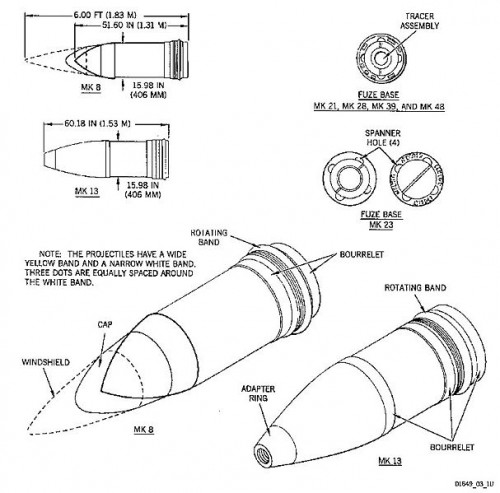
Figure 4 is a good illustration of the differences between the HC and AP projectiles. Notice how the AP shell is basically a big slug of metal that has a windshield on the front of it to make it aerodynamically friendly.

Figure 4: Schematic Diagram of HC and AP 16 Inch Shell Construction.

Figure 4: Schematic Diagram of HC and AP 16 Inch Shell Construction.

Source

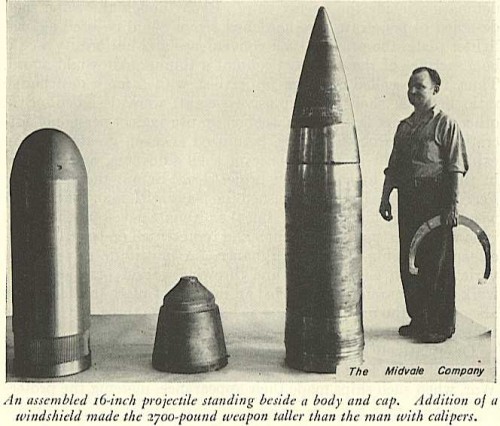
Figure 5 shows the actual pieces of an AP shell.

Figure 5: Breakdown of the Mk 8 AP Shell.

Figure 5: Breakdown of the Mk 8 AP Shell.

Source

Figure 6 shows a dimensioned drawing of the HC projectile. Note that the fuze, which attaches to the nose, is not shown. The full length of the projectile with fuze is 64.00 inches.

Figure 6: Dimensioned Drawing of HC Mk 13 Projectile (No Fuze).

Figure 6: Dimensioned Drawing of HC Mk 13 Projectile (No Fuze).

Source

To illustrate that these projectiles have 9 caliber ogives, I fitted a couple of 9 caliber radii circles to one of the photos (see Figure 7).

Figure 7: 9 Caliber Radii Circles Fitted Manually to a Projectile Photo.

Figure 7: 9 Caliber Radii Circles Fitted Manually to a Projectile Photo.

Conclusion

In this post, I showed that even large projectiles use the ogive shape. I collected some useful historical information into a single spot and will use this data in posts to come on ballistics.

Postscript

See Figure 8 for a snippet from a US Navy manual that describes this projectile.

Figure 8: Snippet from 16-inch Gun Range Table. (Source)

Figure 8: Snippet from 16-inch Gun Range Table. (Source)

Posted in Ballistics | Tagged , | 4 Comments

Ballistics, Ogives, and Bullet Shapes (Part 2)

Example One: Sierra 308 Caliber, 155 grain, MatchKing.

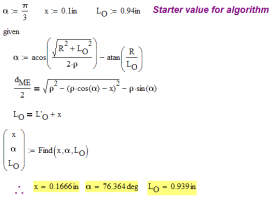
We will first compute the mass for the Sierra MatchKing projectile (tangent ogive) shown in Figure 10. Observe that this projectile has a flattened nose, called a meplat. Because of the meplat, we do not know the full length of the ogive portion of the projectile. As we show below, however, we can use a numerical solver to find the length very easily.

Figure 10: 308 Caliber, 155 Grain, Sierra Example.

Figure 10: 308 Caliber, 155 Grain, Sierra Example.

Source. All units expressed in inches.

We should review some basic units here.

  • bullet mass is expressed in grains, with 1\text{ grain = }\frac{1\text{ lb mass}}{7000}
  • bullet diameter (at least for North America) is expressed in calibers, with one caliber being one thousandth of an inch.

Determination of Ogive Length

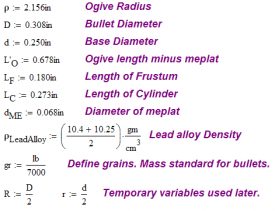
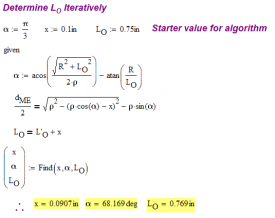
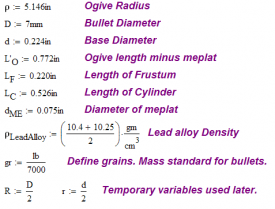
We can use Mathcad to compute the ogive length using its numerical solver. Figure 11 illustrates the calculation. I have defined a length called L' that is the length of the ogive shortened by the meplat. For my equations, I need the length L, which is the length of the full ogive (i.e. not shortened by the meplat). I set up a system of equations that allowed me to solve for L given L' and the meplat diameter.

Figure 11: Variable Definitions for 155 grain Sierra Bullet Example.

Figure 11: Variable Definitions for 155 grain Sierra Bullet Example.

Figure 12: Mathcad Solve Block for 155 Grain Sierra Bullet.

Figure 12: Mathcad Solve Block for 155 Grain Sierra Bullet.


Note that I am estimating the density of the lead alloy by averaging two numbers. I have found various specifications for the density of the alloy and I decided to use the average of the upper and lower values for the range I found. Also, these bullets have jackets made of materials (like copper) with lower density than lead. Some also include steel. The MatchKing actually has a hollow tip. Consider the MatchKing cutaway shown in Figure 13.

Figure 13. MatchKing Cutaway Showing Regions of Lead (Base), Copper (Jacket), and Hollow Tip.

Figure 13. MatchKing Cutaway Showing Regions of Lead (Base), Copper (Jacket), and Hollow Tip.


This will lower the mass of the projectile relative to a solid lead projectile. For my analyses, I will simply use the average of two lead alloy densities.

Mass Calculation

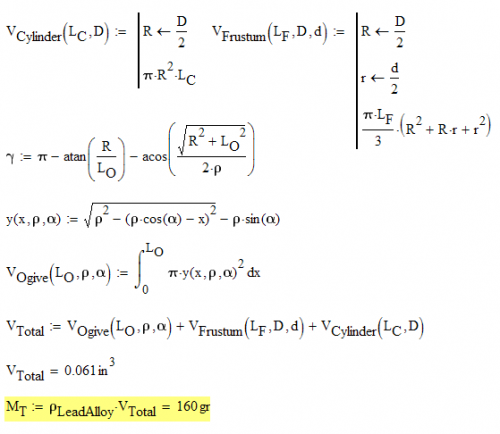
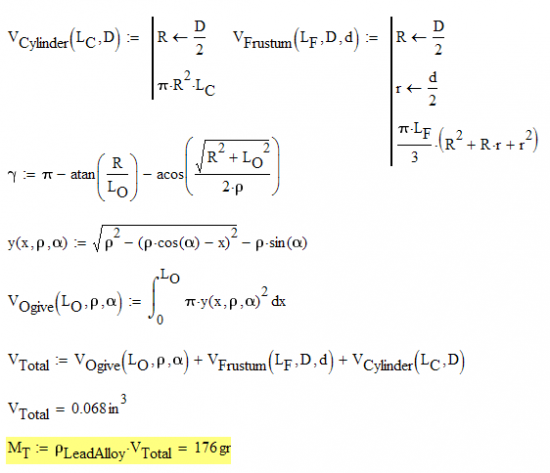
Now that we have the length of the ogive, we can compute the mass of the projectile. Figure 14 illustrates the calculation.

Figure 14: Sierra 155 Grain Mass Calculation.

Figure 14: Sierra 155 Grain Mass Calculation.

As we can see in Figure 14, the computed mass of 160 grains is within 5 grains of the manufacturer's mass specification. This is well within the range possible due to variations in the density of the bullet alloy and the fact that I am ignoring the presence of a jacket.

Example Two: JLK, 7 mm, 180 Grain Bullet.

I found the following drawing for the JLK bullet and thought it would be a good example to use to test my algorithm. This bullet has a secant ogive, which is different than the tangent ogive of Example 1 (i.e. it appears to be more tapered). Figure 15 is a dimensioned drawing of this projectile.

Figure 15: JLK 7 mm, 180 Grain Example.

Figure 15: JLK, 7 mm, 180 Grain Example.

Source. All units expressed in inches.

Determination of Ogive Length

Figures 16 and 17 show the calculation of the ogive length.

Figure 16: Definitions for JLK 180 Grain Bullet.

Figure 16: Definitions for JLK 180 Grain Bullet.

Figure 17: Solve for L in180 Grain JLK Bullet.

Figure 17: Solve for L in180 Grain JLK Bullet.


Mass Calculation

Figure 18 illustrates the calculation of the JLK bullet's mass.

Figure 18: Mass Calculation for JLK Bullet.

Figure 18: Mass Calculation for JLK Bullet.

The calculated mass is within 4 grains of the manufacturer's specification of 180 grains. This is well within the range possible due to variations in the density of the bullet alloy and the fact that I am ignoring the presence of a jacket.

Conclusion

This blog post went through the basic geometry of the ogive and derived a set of equations that allow basic physical parameters such as volume and mass to be computed. Two examples were worked that illustrated how the equations could be applied to real problems. This was a good exercise in the use of basic geometry and applying a computer algebra system to solving a real engineering problem.

Posted in Ballistics | 6 Comments

Ballistics, Ogives, and Bullet Shapes (Part 1)

Introduction

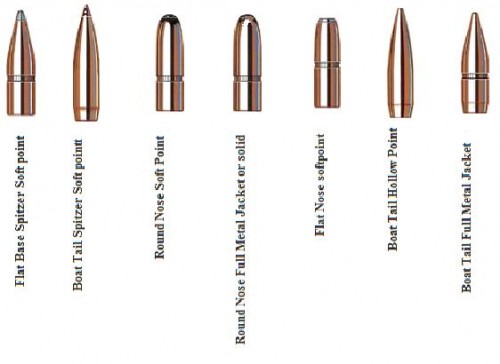
I have always been interested in the shooting sports, but I have not pursued any of them while I was raising my kids. I suddenly find myself with my kids gone and my interest in shooting has reappeared. As part of my interest in shooting, I have been reading the book "Modern Practical Ballistics" by Pejsa. While reading this book, I quickly learned that not all bullet shapes are created equal. So I started to look at how bullet shapes are defined. To give you an idea of the diversity of bullet shapes, I have included Figure 1, which shows a small number of bullet shape examples.

 Figure 1: Example of a Few Bullet Shapes.

Figure 1: Example of a Few Bullet Shapes.

Source

To make this learning exercise more concrete, I decided to focus on developing a general algorithm for computing the mass of a spitzer bullet. I made this choice after reading an interesting article that computed bullet mass using a BASIC program. I used to do a lot of BASIC programming myself, but in recent years I have found computer algebra systems to be more convenient for the working engineer to use on a daily basis. I thought the mass calculation would be a good example to use to demonstrate the power of computer algebra system to solve real problems. I will develop an algorithm for computing the mass of bullet and will test this algorithm on a real bullet design.

The overall exercise was a good exercise in applied mathematics. It also demonstrates the power of a computer algebra system. In this case, I am using Mathcad.

Descriptive Geometry of a Spitzer Bullet

The Pejsa book is focused on the spitzer (German for pointed) bullet shape, and I will concentrate on the spitzer shape as well. Today, it is the most commonly used bullet shape for hunting and target shooting applications. Figure 2 shows how this shape is defined.

Figure 2: Descriptive Geometry of a Spitzer Bullet (Tangent Ogive with Radius of 6 Diameters).

Figure 2: Descriptive Geometry of a Spitzer Bullet (Tangent Ogive with Radius of 6 Diameters).

As shown in Figure 2, the spitzer bullet can be modeled geometrically in three pieces:

  • Ogive (pronounced "Ojive")
    The ogive shape forms the front of the bullet. The ogive shape is formed from the arcs of two circles. The ogive may or may not be tangent at the point of intersection to the cylindrical portion of the bullet. When the circles are tangent to the cylinder portion, we call say this is a tangent ogive. When the circles are not tangent to the cylinder portion, we say we have a secant ogive. The rationale behind the use of the term "secant" can be seen in Figure 6, where there are two horizontal reference lines (brown color) that are both secant lines.
  • Cylinder
    The cylindrical portion of the bullet is what engages the rifling of the barrel.
  • Frustum of a Cone
    The back of the bullet (aka "boattail") geometrically is in the shape of the frustum of the cone Tapering the back of the bullet reduces drag, particularly at speeds less than supersonic.

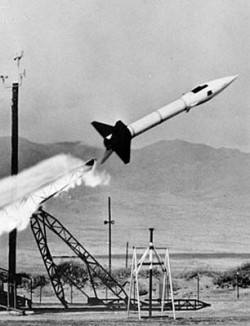
I have included three examples of ogive-shaped projectiles. Figure 3 shows a bullet with a tangent ogive nose. Figure 4 shows a bullet with a secant ogive nose. Figure 5 shows one of the most famous secant ogive noses, which is on the Honest John missile. I cannot imagine the Honest John ogive being used for a bullet, but it does give a feeling for the range of shapes possible using an ogive model.
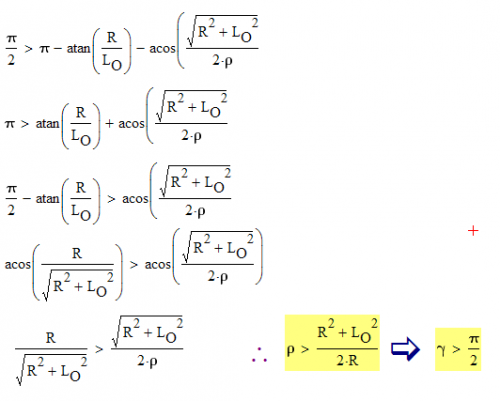

Figure 3: Tangent Ogive Example.

Figure 3: Tangent Ogive Example.

Figure 4: Secant Ogive Example.

Figure 4: Secant Ogive Example.

Figure 5: Secant Ogive Example.

Figure 5: Secant Ogive Example.

Source Source Source

Bullet Mass Calculation

Approach

We will compute the volume of the spitzer bullet as follows.

  • Compute the volume of the frustum portion (VFrustum)
  • Compute the volume of the cylinder portion (VCylinder)
  • Compute the volume of the ogive portion (VOgive)
  • Compute the total volume by summing all the volumes of the pieces
    ({{V}_{Total}}={{V}_{Frustum}}+{{V}_{Cylinder}}+{{V}_{Ogive}})
  • Compute the mass using the density of lead (M=\rho_{LeadAlloy} \cdot {{V}_{Total}})

Frustum Volume

The volume of the backside of a bullet (known as the boattail) has the shape of the frustum of a cone. The formula for the frustum is well known and is given in Equation 1.

Eq. 1 {{V}_{Frustum}}=\frac{\pi \cdot L_F}{3}\cdot \left( {{R}^{2}}+R\cdot r+{{r}^{2}} \right)

Cylinder Volume

Equation 2 is used to calculate the volume of the cylindrical portion of the bullet.

Eq. 2 {{V}_{Cylinder}}=\pi \cdot {{R}^{2}}\cdot L_C

Ogive Volume

Types of Ogives

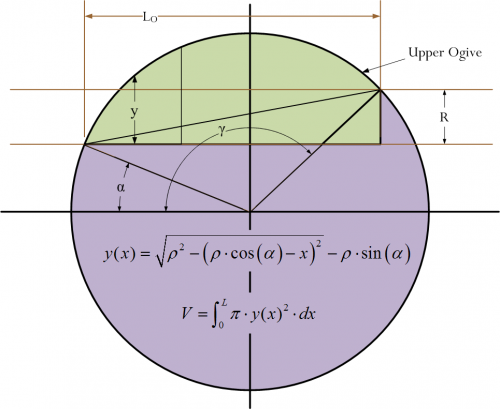
The real work is in computing the volume of the ogive. Let's begin with the variables defined in Figure 6.

Figure 6: Basic Ogive Variable Definitions.

Figure 6: Basic Ogive Variable Definitions.

Using Figure 6, we can see that the different types of ogives are defined by the angle γ. There are three cases (for each case, two criteria are listed– their equivalence is shown at the bottom of this post) :

  • γ < π/2 \left( \rho >\frac{{{R}^{2}}+{{L_O}^{2}}}{2\cdot R} \right)
    The ogive's circular arc is not tangent to the cylinder at the point of intersection. This case results in a rather pointy bullet.
  • γ = π/2 \left( \rho =\frac{{{R}^{2}}+{{L_O}^{2}}}{2\cdot R} \right)
    The ogive's circular arc is tangent to the cylinder at the point of intersection. This results in a rather curved bullet.
  • γ > π/2 \left( \rho <\frac{{{R}^{2}}+{{L_O}^{2}}}{2\cdot R} \right)
    The ogive's circular arc is not tangent to the cylinder at the point of intersection. This case results in a bulbous shape like that of the Honest John missile (see Figure 5).

Analysis

The most important cases for bullet design are when γ π/2 and the following drawings will focus on these cases. However, the equations are general and apply to all cases. We begin our ogive analysis with Figure 7, which contains the definitions of the critical angles and lengths.

Figure 7: Definitions of Ogive Angles.

Figure 7: Definitions of Ogive Angles.


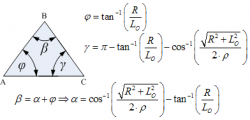
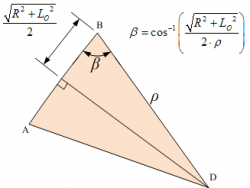
We need to calculate angles α and γ. To accomplish this task, we will be working with two triangles from Figure 7 (see Figures 8 and 9).

Figure 8: Angles Alpha and Gamma Derivation.

Figure 8: Angles Alpha and Gamma Derivation.

Figure 9: Triangle for Deriving Angle Beta Equation.

Figure 9: Triangle for Deriving Angle Beta Equation.

Using Figures 7, 8, and 9, we can derive the key equations (Equations 3-6). I have used basic trigonometry and will the let the figures stand for themselves. These equations will be used in part 2 to compute the mass of two projectile examples.

Eq. 3 \alpha ={{\cos }^{-1}}\left( \frac{\sqrt{{{R}^{2}}+{{L_O}^{2}}}}{2\cdot \rho } \right)-{{\tan }^{-1}}\left( \frac{R}{L_O} \right)
Eq. 4 \gamma =\pi -{{\tan }^{-1}}\left( \frac{R}{L_O} \right)-{{\cos }^{-1}}\left( \frac{\sqrt{{{R}^{2}}+{{L_O}^{2}}}}{2\cdot \rho } \right)
Eq. 5 y(x)=\sqrt{{{\rho }^{2}}-{{\left( \rho \cdot \cos \left( \alpha  \right)-x \right)}^{2}}}-\rho \cdot \sin \left( \alpha  \right)
Eq. 6 V_{Ogive}=\int_{0}^{L_O}{\pi \cdot y{{(x)}^{2}}\cdot dx}

Note that two equivalent criteria were listed for identifying the type of ogive. Equation 2 can be used to demonstrate this equivalence. Included below is a short derivation showing that \gamma < \frac{\pi }{2} => \rho > \frac{{{R}^{2}}+{{L_O}^{2}}}{2\cdot R} . The equivalence between the other criteria can be demonstrated similarly.

Derivation Demonstration Using Equation 2

Derivation Demonstration Using Equation 2


Continued on Part 2

Posted in Ballistics | 23 Comments

Pope Gregory XIII and Dual Modulus Counters

Quote of the Day

Every new body of discovery is mathematical in form, because there is no other guidance we can have.

— Charles Darwin


Introduction

FIgure 1: Pope Gregory VIII.

Figure 1: Pope Gregory VIII (Source).

I discussed a recent dual-modulus counter design in a previous post. I had not thought much about the history of these counters, but I noticed that our calendar is really a dual-modulus counter. Pope Gregory XIII (Figure 1) established the Gregorian calendar (1582) to resolve issues with the Julian calendar. The reason that calendar development is complicated is because a solar year is 365.24219879 days long, which is not easily expressed in terms of simple integer ratios. Ideally, a calendar system is chosen that is simple and that has a mean year length exactly equal to that of a solar year. While not ideal, the Gregorian calendar provides a simple and fairly accurate approximation to a solar year through the use of a dual-modulus counter design based on years with durations of 365 and 366 days.

Analysis

In the Gregorian calendar, years have lengths of either 365 or 366 days (hence, a dual-modulus). The number of days in a year is given by the following rules

  • Every year that is exactly divisible by four is a leap year, except for years that are exactly divisible by 100.
  • Years exactly divisible by 400 are still leap years.

Using these rules, we can compute the length of a Gregorian year as shown in Equation 1.

Eq. 1 {{T}_{Year}}=\frac{400\cdot 365+3\cdot 24+25}{400}=365.2425\text{ days}

This is a good approximation to the length of a solar year – the error is only 0.0031 days per year. This means that the it will take over 3000 years for the Gregorian calendar to accrue a single day's worth of error.

Save

Posted in Astronomy, Electronics | Tagged , | 1 Comment

The Difficulties Posed By Communications

Quote of the Day

The single biggest problem in communication is the illusion that it's taken place.

- George Bernard Shaw


Figure 1: Time Zones Around the World. (Source)

Figure 1: Time Zones Around the World. (Source)

My company currently has engineering work occurring at a number of sites that are widely separated geographically. For example, much of my time is spent communicating with China and Portugal. Relative to my time zone (Figure 1), China is 14 hours ahead and Portugal is 6 hours ahead.

Trying to coordinate these sites is definitely a challenge. However, this really is nothing new. When I was at HP, my first manager used to say that

Engineering communication reduces by 10 dB per foot.

He used this quote whenever we were trying to move team members physically close to one another to facilitate personal communication. This quote reflected the needs of a time when engineering sites were all in the US and the time zones were within a few hours of one another. It was also a time before email was readily available.

One of my current co-workers made the observation that this quote needs to be updated based on the changes due to new communication technology being implemented into the workplace, like a sip server, amongst others. He said that the statement should be revised to be

Engineering communication reduces by 10 dB per hour of time zone difference.

As I think about it, he is right. Distance does not matter anymore – time does. Working with China means phone calls late at night for someone, and I personally have seen how painful this is. It also means that emails are not answered quickly. Of course, large time zone differences mean that language differences occur, which may be the greatest challenge.

Posted in Management | Tagged , | Comments Off on The Difficulties Posed By Communications

The Law of Employee Retention

I was just interviewing a large number of people as part of an acquisition. After the interviews were done, the interviewers all went out to dinner and discussed the day's events. While at dinner, the topic of employee retention came up. It was during this discussion that I stated my "Law of Employee Retention." The law is simple and is stated in terms of "half-life", which means the time in which 50% of the employees will leave.

An engineer with a spouse whose family is located "far away" has a retention half-life of 5 years.

"Far away" means that the spouse's family is far enough away that plans need to be made to visit them.

I have over 30 years of experience with this rule. I started gathering my data when I was a recruiter with HP. It even worked for me and my wife. I lasted five years with HP before my wife wanted to get closer to her family.

Posted in Management | Tagged , , , | Comments Off on The Law of Employee Retention

Dual Modulus Counter Design Example

Quote of the Day

I have long been of the opinion that if work were such a splendid thing the rich would have kept more of it for themselves.

Bruce Grocott, British politician


Introduction

One of the more common problems in the life of a digital hardware designer is to divide down a master clock to some desired lower frequency value. If life is kind, the master clock is an integer multiple of the desired clock and the problem can be solved with a simple counter. Unfortunately, life is rarely kind and the master clock frequency is usually not an integer multiple of the desired clock. In this case, the designer will need to do a little work. One common solution is to use a dual-modulus counter. This blog will work through an example that came up a while back.

What is a Dual-Modulus Counter?

The dual-modulus counter allows us to design a clock divider with a non-integer modulus, which I call M. Figure 1 illustrates the basic idea. In Figure 1, we desire a modulus that is between N and N-1. We vary the duty cycle of each counter so that the average modulus equals M. Clearly, the instantaneous frequency will never be exactly what we want. But many problems require only that the average value be exactly right and the instantaneous value is of less interest.

Figure 1: Block Diagram of a Dual-Modulus Counter.

Figure 1: Block Diagram of a Dual-Modulus Counter.

Basic Dual-Modulus Mathematics

We can compute the modulus we desire using Equation 1.

Eq. 1 M\triangleq \frac{{{f}_{0}}}{{{f}_{D}}}

where M is the desired modulus, f0 is our master clock, and fD is desired output frequency from the dual-modulus divider. Of course, f0 > fD.

Let's assume that N and N-1 are integers such that N > M > N-1. N and N-1 are the moduli of our counter. We can compute the value of N (and correspondingly, N-1) as shown in Equation 2.

Eq. 2 N=\text{ceil}\left( M \right)

As shown in Equation 3, we can restate M in terms of its integer and fractional part, where the fractional part is assumed to be expressible as an integer ratio A/C.

Eq. 3 M=\left( N-1 \right)+\frac{A}{C}

where A represents the number of N-1 division operations in a cycle and C represents the total number of division cycles (both N and N-1).

Eq. 4 \frac{{{f}_{0}}}{{{f}_{D}}}=\left( N-1 \right)+\frac{A}{C}\Rightarrow \frac{A}{C}=\frac{{{f}_{0}}}{{{f}_{D}}}-(N-1)=\frac{{{f}_{0}}-\left( N-1 \right)\cdot {{f}_{D}}}{{{f}_{D}}}

Ease of implementation requires that we make sure that A and C are relatively prime (i.e. no common factors). Equation 5 shows how to compute both A and C.

Eq. 5 Q=\gcd \left( {{f}_{D}},{{f}_{0}}-\left( N-1 \right)\cdot {{f}_{D}} \right)
A=\frac{{{f}_{0}}-\left( N-1 \right)\cdot {{f}_{D}}}{Q}
C=\frac{{{f}_{D}}}{Q}

Given these equations, we can generate a high-level design for our dual-modulus counter.

One Thing to Note

The dual-modulus counter will divide the master clock by N and N-1. One could do all the divide-by-N operations and then all the divide-by-(N-1) operations. While correct, the generated output clock can have some rather large phase variations from an ideal output frequency. These phase deviations can be minimized by evenly mixing the N and N-1 divisions.

There are various ways to spread the divisions out. I will not dwell on these approaches here, but in the Worked Example below I do illustrate one approach in my Mathcad model.

Worked Example

Computing the Constants

We had a problem a while ago where we needed to generate a 2.048 MHz clock from a 78.125 MHz clock. I threw this example into Mathcad and the results are shown in Figure 2.

Figure 2: Dual-Modulus Worked Example.

Figure 2: Dual-Modulus Worked Example.

Spreading the Different Divisions Out

One can use the modulo operation to spread the different divisions out. Figure 3 illustrates the approach. The vector m in Figure 3 has entries equal to their count values (i.e. 0 to 2047), which means each entry corresponds to a division. I divide by 39 for every entry where the index mod (2048/301) passes through 0 and I divide by 38 for all other entries. The quotient of 2048/301 is the total number of division cycles divided by the number of divide-by-39 cycles. This spreads the divisions out evenly.

Figure 3: Evenly Spreading Out the Divisions.

Figure 3: Evenly Spreading Out the Divisions.

Conclusion

This blog post shows how to design a basic dual-modulus counter. It presents both the theory and a worked example. This example is very similar to a frequency divider that is currently out in the field inside thousands of units.

For an example of a dual modulus counter design that everyone is familiar with, see this post on the Gregorian calendar.

Save

Save

Save

Posted in Electronics | Tagged | 4 Comments