Old Farmer Science - Hay Fires

Introduction

Yesterday, my wife and I went to dinner with a couple that are our neighbors. During our dinner conversation, my neighbor's wife mentioned that she had been listening to radio and had heard a story about a local barn that was full of hay catching fire. She asked me if I knew anything about how hay can catch fire. That simple question really brought back some old memories of my father and grandfather – these memories always make me smile. So I started to tell her all about hay fires ...

Barn Fires

Back in the early 1960s, my father and his four young sons spent a lot of time in a 1956 Chevy Belair driving country roads to and from the old family farmstead. Grandpa was old and sick at this time, and my uncle Harvey had taken over the family farmstead. My father liked to help his brother out with the farm work on the weekends. On the drive to the farm, it was not uncommon for us to see the remains of someone's barn smoldering. Occasionally, we even saw the barn ablaze, which is probably why some people today opt for a metal barn instead of a wooden one. They are currently very popular among farmers, as well as anyone else who is looking to construct a new building for their particular needs. An added benefit of this option is that you will have access to cheap metal buildings that so many companies can offer you these days. This ultimately means that you will have a barn that is very unlikely to burn down from a fire, as well as one that doesn't throw you out of pocket. It's a win-win.

As such, some may look to places that sell these types of barns similar to Tassie Sheds who provide Quality Sheds and barns. One day I asked my father and grandfather what caused these fires. Their answer was interesting.

Spontaneous Combustion

In many ways, a barn's haymow is a very big compost pile. When you put together organic material , moisture, and a little heat, you will get bacterial fermentation. Fermentation produces heat that can cause spontaneous combustion and a barn fire under the proper conditions.

Prevention

Dad and Grandpa were pretty proud of the fact that they had never had a barn fire. They told me that to avoid barn fires, you have to follow "the rules":

  • Do not put hay into the barn wet.
  • Occasionally drive a pipe into the haymow, attach a thermometer to a string, drop the thermometer on the string down the pipe, and measure the temperature. If the temperature exceeds 180°F, the hay has got to be removed from the barn.
  • Be careful when you remove the hay – the hot hay can burst into flame when it is exposed to the air.

All I can say is that their rules must have worked. They never had a barn fire.

Modern Information

When my wife and I returned from dinner, I thought I would look up some modern information on hay fires and see if anything had changed. It turned out that not much has changed. But there are some additional details that are worth mentioning.

  • As the temperature rises, the most common bacteria die off. However, in some cases there are heat-loving bacteria (known as thermophiles) present. If they are present, an unstable situation occurs. More heat cause more bacterial growth, which results in even more heat and bacterial growth.
  • The reaction rate doubles for every 10°C rise in temperature. For those of you chemistry fans, this is a great example of the Arrhenius equation in action.
  • The exponential growth rate of the reaction with temperature means that the reaction can very quickly get out of control.

The following critical temperatures are listed in a Wikipedia reference.

  • 150 °F (65 °C) is the beginning of the danger zone. After this point, check temperature daily.
  • 160 °F (70 °C) is dangerous. Measure temperature every four hours and inspect the stack.
  • At 175 °F (80 °C), call the fire department. Meanwhile, wet hay down and remove it from the barn or dismantle the stack away from buildings and other dry hay.
  • At 185 °F (85 °C) hot spots and pockets may be expected. Flames will likely develop when heating hay comes in contact with the air.
  • 212 °F (100 °C) is critical. Temperature rises rapidly above this point. Hay will almost certainly ignite.
Posted in Farming | 3 Comments

The Mathematics of Dieting - Part 2 (Cholesterol)

Cholesterol and Me

I actually have never had a cholesterol level that would be considered high. The threshold for a high total cholesterol level is generally considered to be anything above 200 mg/dL. Prior to taking a statin to lower my cholesterol level, my highest total cholesterol level was 180 mg/dL. However, my father died at 45 from a heart attack and that means that I have a family history of heart disease. So my doctor recommended that I work to lower my total cholesterol level. I have taken his recommendation seriously. Prior to starting my diet, my cholesterol level while on the statin was 120 mg/dL. After my diet, it has been measured 3 times between 70 mg/dL and 80 mg/dL. In fact, my life insurance company complained that my cholesterol is now too low. I cannot win. There are many things that can be done though to help you with your health. Especially where your cholesterol levels are concerned. For example, some people find that taking rosuvastatin can be helpful. You can learn more about crestor generic and rosuvastatin by visiting the Blink Health website. Diet and exercise are also important, but another thing that you could do would be to just get a good night's sleep. If you struggle to fall asleep quickly then one thing you could do would be to get yourself a new mattress. Why not check out something like this memory foam mattress here?

In my youth, I used to actually make money from cholesterol. When I was in college, I worked as a technician at a college chemistry laboratory. One of my many jobs was to grind up gallstones from a local hospital for use in organic chemistry labs as a source of cholesterol. I was amazed at how large some of the gallstones could be. They must have hurt pretty bad!

Typical Gallstones (Source: Wikipedia)

Typical Gallstones (Source: Wikipedia)

I first got interested in how my cholesterol level was calculated when I noticed that my total cholesterol level was not equal to my HDL plus LDL. A little research soon showed that triglycerides were involved in the equation. I will have more to say about this later in this post.

Measuring Your Cholesterol Level

Most people have had a fasting cholesterol test. A routine fasting cholesterol test measures three things:

  • Total Cholestrol (TC)
  • Triglycerides (TG)
  • High-Density Lipoprotein (HDL) cholesterol

People often refer to HDL as "good cholesterol" and LDL and "bad cholestrol." Your Low Density Lipoprotein (LDL) cholesterol normally is not measured directly. It is calculated using the Friedewald formula.

LDL = TC - HDL - \frac{{TG}}{5}

You can google "Friedewald" about this formula and you will find a number of web sites that criticize the accuracy of this formula (e.g. Wikipedia entry on Friedewald Equaton or this blog post). The criticism center on errors that are present for folks with high triglyceride levels (greater than 400 mg/dL). As often occurs, there are competing regression equations that are claiming superior results (e.g. "Iranian" formula).

There are also some folks who claim the Freidewald formula is inaccurate for people with low total cholesterol levels. Take a look here for a start. Many of the web references state that the problem with both the Freidewald and Iranian equations are that they were developed from data gathered from people with high cholesterol levels. I will leave it to the specialists to argue these points. I will only address what my doctor does. He is a good guy and I trust him.

Cholesterol Metrics

My doctor sends me a report with a number of cholesterol metrics on it.

  • Total Cholesterol (goal is less than 200 mg/dL)
  • HDL Cholesterol (goal is greater than 40 mg/dL)
  • Calculated LDL Cholesterol (goal less than 100 mg/dL)
  • Cholesterol HDL Ratio (goal of 4 or less)

Let's walk through one of my pre-diet test results to illustrate what they report. I am using my pre-diet results because they are closer to what most people see.

ParameterValue

My Cholesterol Test Results
Total Cholesterol 118 mg/dL
Triglycerides 88 mg/dL
HDL 27 mg/dL

Given this data, you can duplicate my doctor's LDL calculation using the Freidewald formula.

LDL = 118\frac{{{\text{mg}}}}{{{\text{dL}}}} - 27\frac{{{\text{mg}}}}{{{\text{dL}}}} - \frac{{88\frac{{{\text{mg}}}}{{{\text{dL}}}}}}{5} = 73\;\frac{{{\text{mg}}}}{{{\text{dL}}}}

The calculation of my cholesterol ratio can be reconstructed as shown below.

\frac{{{\text{TC}}}}{{{\text{HDL}}}} = \frac{{118\frac{{{\text{mg}}}}{{{\text{dL}}}}}}{{27\frac{{{\text{mg}}}}{{{\text{dL}}}}}} = 4.4

Since this old test, I have increased my HDL into the mid-30s and reduced my total cholesterol into the mid-70s. I am afraid that I will always struggle with getting my HDL above 40. I have not given up, but I have not been able to increase this number into the 40s yet.

My Personal Experience with Diet and Cholesterol

I know of a number of people who are trying to control their cholesterol through diet alone. A quick summary of my experience would be:

  • Atkin's Diet: I tried this diet for awhile, but I could not stay on it. However, while on it I had great HDL levels. I discussed this with my doctor and he commented that he had seen similar results with other patients who were on the Atkin's diet. However, this diet simply was not workable for me.
  • Niacin supplements: I and a co-worker have both tried this. He had a problem with "flushing." In both of our cases, niacin had minimal impact on our HDL levels. It can be worth understanding how to get rid of gallstones naturally. So you have another option if the previous supplements don't work for you.
  • Exercise: I have had the most long term success with exercise. It took some time, but daily aerobic exercise is now part of my life. I actually do not feel right when I miss an exercise session. Everyone has different ways of exercising, I have friends who love basketball and go out for it daily. And I have other friends that prefer to take Tennis Lessons once or twice a week. So long as you're getting regular exercise you'll be doing your body the world of good.

Disclaimer

I am not a doctor, just a person interested in my health. See your doctor for advice about your particular situation.

Posted in Dieting, Health | 1 Comment

Max Planck was Nice Guy

I am reading a great book called "Plutonium: A History of the World's Most Dangerous Element" by Jeremy Bernstein. The history of plutonium has been touched by many of the greatest minds in physics. One of the more intriguing people in the book is the physicist Lise Meitner. Because of gender discrimination, she had to battle to become a physicist. Her mentor, Max Planck, is considered today to be the founder of quantum mechanics and was one of the world's leading physicists when Lise was a student in the early years of the 20th century. His work is honored by physicists today with the term "Planck's constant," a number that relates the frequency of a photon to its energy.

Lise Meitner - Pioneer in the Physics of Fission (Source: Wikipedia)

Lise Meitner - Pioneer in the Physics of Fission (Source: Wikipedia)

Max Planck - 1918 Physics Nobel Prize Winner

Max Planck - 1918 Physics Nobel Prize Winner (Source: Wikipedia)

During a time when gender discrimination was rampant in physics, Planck took the unusual step of allowing Meitner to attend his lectures and later made her his assistant. Bernstein comments that "[Planck] was probably the most important physicist in Germany. He was also a very decent man." I have another Max Planck story that I have never seen in print that also describes what a decent man he was.

I went to North Hennepin Community College for my first two years of college. I still think of this school fondly as providing me the two best years of education that I ever had. One of the physics professors, Roger Johnson, invited me to attend the 1976 Nobel Conference at Gustavus Adolphus University. These conferences are held annually. For a kid from "Small Town USA," this was a big deal. One of the lectures there was given by Victor Weisskopf, an important contributor to the development of quantum mechanics. He told many stories about all the big personalities in physics during the early 20th century when quantum mechanics was being developed. One story he told was about a letter he sent when he was twelve to Max Planck. As a boy, Weisskopf loved science and was looking for career guidance. He had written the letter to Planck in a tone that was much like a young person today might write to their favorite athlete or singer. He said that Planck responded back to him with a very kind letter of encouragement. Weisskopf then wondered out loud how many of the world's leading physicists today would respond similarly to a young man's fan letter. I found Weisskopf's telling of this story to be very touching and that is why I have remembered it over all these years.

Weisskopf also had a story about Wolfgang Pauli that was pretty cute. Pauli was one of great physicists of the 20th century ("Pauli Exclusion Principle"), and he was famous for being a tough customer. When Pauli was hiring assistants, he chose Weisskopf over Hans Bethe. Bethe later became a physics powerhouse – Freeman Dyson referred to Bethe as the "supreme problem solver of the 20th century." Weisskopf said that when he presented his first work to Pauli, Pauli's only response was "I should have chosen Bethe." Weisskopf laughed when he told the story, but I am sure it hurt at the time.

Posted in History of Science and Technology | Comments Off on Max Planck was Nice Guy

Designing A Stairway For My Cabin

I live in Minnesota, where owning a cabin on a lake in the northern half of the state is part of the culture. Here is a picture of my little piece of northern Minnesota.

My Little Northern Minnesota Cabin

My Little Northern Minnesota Cabin

My cabin sits on a small hill about 15 feet above the lake. Unfortunately, the hill is rather steep and a bit difficult to negotiate, particularly for the older folks. At this point, there is only a dirt path up the hill. To add to the difficulty, the dirt path is strewn with rocks and tree roots that make it even more difficult to scale. We thought about looking for a cabin in another location, we even found prefab cabins for sale online, but decided against it when we started talking about making our cabin more accessible.

One of my friends lives in Australia and has recently had a small granny flat built on his property and is also currently in the process of making it more accessible for his elderly relatives. He originally was going to build a cabin, but decided to upgrade to a granny flat instead. There are a fantastic range of cheap granny flats out there, so if you are thinking of building one on your land, make sure to do some research to ensure you get the best deal for your money.

As for my cabin though, I need to build a stairway between the lake and the top of the hill. This project is quite different from building a staircase indoors. In all honesty, I'd probably just use a professional like Pear Stairs if it was! Since summer is just about over and I do not use the cabin in the winter (brrr!), this will be a project for next spring. This means that I have some time to design the stairway. I will have several blog post on this design effort. For today, I will be looking at the basic design equations for a simple, straight flight of stairs.

Let's begin by illustrating four key stair terms using the following figure.

Illustration of Some Key Stair Design Terms Used in This Blog Post.

Illustration of Some Key Stair Design Terms Used in This Blog Post.


The definitions of these four terms are given in the following list.

  • TRise : Total Rise – The total (finish floor-to-finish floor) height of the stairs.
  • TRun : Total Run – The total horizontal distance occupied by the stairs.
  • uRise : Unit Rise – The rise of a single step of the stairs.
  • uRun : Unit Run – The horizontal distance occupied by a single step of the stairs.

The Stair Design Process

The basic process of stair design is straightforward.

  1. Measure the Total Rise
  2. Calculate the Number of Risers
  3. Calculate the Unit Rise
  4. Calculate the Unit Run
  5. Calculate the Total Run

Measuring the Total Rise

The total rise of stairs is the one stair parameter that is generally fixed right from the start. However, there is some room for error. While the rough flooring-to-rough flooring height is fixed, the steps must be designed to provide equal riser heights after the finish floors are installed. This means that you have to obtain accurate estimates of the heights of the finish floors at both the lower and upper levels of the stairs before they are installed.

We can illustrate the measurement and estimation processes using the following figure.

Estimating Finished Floor-to-Finished Floor Height

Estimating Finished Floor-to-Finished Floor Height

We can compute the finished floor-to-finished floor height, TRise, using the following equation.

{T_{Rise}} = {T_{RoughRise}} + {\tau _U} - {\tau _L}

where TRoughRise is the rough floor-to-rough floor height, \tau_U is the thickness of the upper finished floor, and \tau_L is the thickness of the lower finished floor.

Calculating the Number of Risers

Most cities are adopting the International Residential Code (IRC) for the construction of single-family residences (often with some modification). This code states that the maximum riser height is 7.75 inches. However, I personally find a riser height of 7.75 inches to be rather high (some local areas allow a unit rise as high as 8 inches). A good nominal maximum for most people is 7 inches, though a shorter maximum may be more appropriate for facilities occupied primarily by children or the elderly. The IRC has no minimum riser height – it allows all the way to zero (i.e. a ramp).

N = \text{ceiling} \left( {\frac{{{T_{Rise}}}}{{7{\text{ inches}}}}} \right)

where N is the number of steps and ceil is the ceiling function, which always rounds up. This approach ensures that unit rise is always less than or equal to 7 inches.

Determining the Unit Rise

Once you have N and TRise, determining the unit rise is easy.

{u_{Rise}} = \frac{{{T_{Rise}}}}{N}

For ease of measurement, you may wish to round the final result to a value that is convenient to measure (e.g. a multiple of 1/8 of an inch).

Determining the Unit Run

Determining the unit rise seems to be confusing to folks. I believe this is because there are some options as to how you compute it. There are three commonly used equations for calculating uRun given uRise, which I list below.

Equation 1: {u_{Run}} = k - {u_{Rise}}{\text{, where 17}} \leqslant {\text{k}} \leqslant {\text{18}}
Equation 2: {u_{Run}} = k - 2 \cdot {u_{Rise}}{\text{, where 24}} \leqslant {\text{k}} \leqslant {\text{25}}
Equation 3: {u_{Run}} = \frac{k}{{{u_{Rise}}}}{\text{, where 74}} \leqslant {\text{k}} \leqslant {\text{75}}

The equations may appear complicated but really they are simple. Basically, you select a uRun that makes at least one of the equations true. The range of k values allows you to use values for the unit rise and unit run that are convenient to measure (e.g. multiples of an 1/8 or 1/4 inch).

These three equations actually produce similar results. To illustrate this point, consider the following graph. I made the graph by setting k equal to the mid-point of its allowed range for each of the equations.

Graph of Stair Angles Versus Equations and Riser Height

Graph of Stair Angles Versus Equations and Riser Height

There are a few points that are worth making about the graph:

  • The stair angles range from 30° to 44°.
  • Equation 1 produces a stair angle that is less steep than the other equations for unit rises greater than 7 inches.
  • Equation 2 and 3 produce stair angles that are less steep for unit rises less than 7 inches.

At a unit rise of 7 inches, all the equations produce stairs with the same angle or slope. At all other unit rises, each of the equations produces slightly different angles. The differences in angles can be useful when trying to fit a stairs into a specific total run.

Determining the Total Run

Once we have uRun, determining the total run of the stairs is straightforward.

{T_{Run}} = N \cdot {u_{Run}}

The total run of stairs is important because it tells you how much of your lower level space the stairs will require. There frequently is some iteration required to get a workable combination of unit rise, unit run, and total run that fits in the allotted space and people can comfortably climb.

Conclusion

This blog post covered the basic math. Real stairs usually include some complications. For example, the IRC does not allow you to have a stairs with more than 18 steps without a landing. This requirement will figure prominently in my cabin stairway. In one of my stair blog posts to come, I will go through the actual numbers associated with my cabin stairs.

Posted in Construction | Tagged | 7 Comments

The Mathematics of Dieting – Part 1 (BMI)

The Problem

This is a story with a very happy ending. I have been overweight for most of my 50+ years. I have tried to diet unsuccessfully many, many times. It can be hard especially if you don't face the issue at hand and look in the mirror and say "I can't stop eating" so you can finally address what you need to do. Two years ago, I started a weight loss plan that resulted in me losing 103 pounds over a period of 9 months and achieving my weight loss goal. Moreover, I have been able to maintain a stable weight in the 14 months since I went off my weight loss plan and starting maintenance. I will use several blog posts to discuss what I did to lose this weight. There was no magic, but it was interesting.

What was different this time from all the other times? This time, I turned weight loss into a math problem.

Motivations

Ultimately, the key to long-term weight loss is behavior modification. The key to behavior modification is motivation. Three things happened that provided me the motivation that I needed to diet seriously.

  • My youngest son was looking at some old pictures of me and commented that he had never seen me as thin as I was in some of the pictures. He did not say this in a mean manner, but it caused me to think about the example that I had set for him. I distinctly remember saying to myself that I can change this situation.
  • Years before I had bought a life insurance plan that increased in cost every year. Because of my weight, it was expensive. Basically, every month I received a bill for being overweight and I did not like how it was rising. I wondered many things, if should I stick with it, do I need Final expense insurance, or would a change to a fixed-rate policy save money? I realized if I wanted the latter I had to lose weight.
  • I hired a senior-level natural bodybuilder on to my engineering team. This gentleman literally changed my life. I have concluded that bodybuilders know a lot and that people should listen to what they say very carefully.

These are all good reasons, but the real reason came down to my family. When you get right down to it, most overweight people would like to lose weight, but simply doing something good for themselves is not sufficient motivation. You need to find a reason that is bigger than yourself. In my case, it was decided that I needed to do all that I could to ensure that I will be there when family needs me.

Timing

My doctor told me that I needed to have a baseline colonoscopy – one of the joys of turning 50. Since I was going to be empty anyway, I decided to turn my colonoscopy into a weight loss opportunity. My diet would begin the second week of November with my colonoscopy.

Since I am a person that always needs a date goal to strive for, I looked at the calendar and I could see a number of important dates in the near future.

  • My wife and I were going on a cruise in March.
  • My yearly physical was scheduled for May.
  • My son was going to be back home on the fourth of July.
  • My life insurance rate was scheduled to increase in August.

I chose July 4 as my date for hitting my goal weight because it was far enough in the future (9 months) that I would have a credible chance of losing 103 pounds. I would also be able to avoid my life insurance rate increase by qualifying for a cheaper policy. This meant that I needed to lose 11.4 lb/month. That sounded hard but doable. Anyone who has a life insurance policy like me will be aware of what you need to do to make sure you get a good deal. I know people who have shopped around for a while and checked out companies like Curo Financial to see what policies they can get so they are all set.

Life Insurance Math

I reviewed the life insurance policies of a number of companies: AAA, Prudential, Met Life, etc. All the policies had a common theme – they predicted your personal risk based on your Body Mass Index (BMI). They did not come right out and say BMI, but you could see that their tables were derived using the BMI equation.

BMI Basics

BMI is very simple formula that has major implications for the cost of your insurance.

BMI = \frac{m}{{{h^2}}}

where m is the body mass in kilograms and h is the body height in meters. This formula is used around the world to assess the body mass situation of groups of people.

The medical folks assign labels to different BMI ranges.

BMI Categories
BMI Range Category
‹ 16.5 Severly Underweight
16.5–18.4 Underweight
18.5–24.9 Normal
25.0–29.9 Overweight
30.0–34.9 Obese Class I
35.0–39.9 Obese Class II
› 40 Obese Class III

A person who is Obese Class III is often referred to as "morbidly obese." There are international variations on these thresholds.

BMI Trivia

Here are some commonly cited BMI values.

Example Calculation

Let's walk through an example calculation by using the typical American female supermodel as an example.

  • average height = 5' 10'' = 1.778 meters
  • average weight = 115 lb = 52.163 kg

The calculation is straightforward.

{\left. {BMI} \right|_{Supermodel}} = \frac{{52.163{\text{ kg}}}}{{{{\left( {1.778{\text{ m}}} \right)}^2}}} = 16.5{\text{ }}\frac{{{\text{kg}}}}{{{{\text{m}}^{\text{2}}}}}

Issues with BMI

I view BMI as a type of figure of merit. As a figure of merit, it definitely has some issues. For example, the units of BMI are kg/m2. Intuitively, this seems odd because the units look like a mass per unit area. If tall people were simply large versions large-versions of short people, it seems that the units should be kg/m3, which is the same as a density. Since muscle weighs more than fat, I can see where higher densities might be good and lower densities might be bad. While this makes intuitive sense, it is clear that tall people are not scaled up short people and that using a density form of measure would not work. Note that BMI is calculated the same for men and women, who definitely are constructed differently. So it seems that the use of height-squared is a compromise form of metric.

In fact, most medical experts say that while BMI has value with respect to populations, it has less value with respect to an individual. Individuals vary greatly with respect to muscle mass and skeletal frame. For example, the bodybuilder on my work team has a BMI of 33. This puts him in the Obese Class I category, but he has a body fat percentage that is less than 12% (when competing it is around 7%). I guarantee you that he is not obese by any definition other than BMI.

All this being said, since the insurance companies use BMI for medical underwriting, so we are stuck with it and have to use it. Its main advantage is that it is easy to compute.

My Personal BMI Situation

Alas, my personal BMI situation at the start of my diet was not good – it was 42.5. I was morbidly obese (the word "morbidly" makes me shudder). I had my work cut out for me. As it turned out, I hit my target weight on July 4 exactly.

Posted in Dieting, Health | Tagged , , , | 1 Comment

Book Review: Ratio by Michael Ruhlman

Introduction

I have always thought that there was something magical about baking. I especially like recipes that make things that rise. I think it is almost magical the ways breads and cakes grow into their final form. Because of my interest in baking, I have decided to learn to bake.

When I want to learn something, I use a "full court press" approach: classroom study, supplementary book reading, and good projects. I have been applying this approach to learning baking.

  • I am taking courses from "Cooks of Crocus Hills"
  • I have put together a small library of baking references from which I am making recipes
  • I am trying all sorts of bread recipes

The Book Review

One important book in my library is the book Ratio by Michael Ruhlman [1]. This book explains why recipes are built the way they are. For a mathematical person, it takes the mystery out of recipe construction. One issue that I have had with baking is that it has always seemed to contain mysterious procedures (recipes) with no rationale behind the procedures. I am always suspicious when I need to follow a procedure and I do not understand the rationale behind each and every item in the procedure. I have been working through the book (I am not quite done) and I have found it to be an excellent introduction to theory of recipe construction.

I first heard about the book when Ruhlman was interviewed on National Public Radio. The genesis of the book involved the author (Ruhlman) meeting a chef (Uwe Hestnar) who believes that that cooks do not need to have shelves full of recipe books — all they need is a list of 26 types of recipes and their ingredient ratios. Chef Hestnar has created 26 categories of fundamental cooking building blocks and the ratios of flour, eggs, sugar, liquids, and fats required to make all of them. Ruhlman has created a book that carefully walks the reader through these ratios and why the ratios are set the way they are.

I have really like having this book. It has taken the mystery out of recipes. I have compared Ruhlman's ratios with the ratios of many popular recipes. His ratios seem to hold with reasonable accuracy across all the recipes I have looked at. I now feel like I can walk into a kitchen without any recipes and produce some very good food with just a basic knowlege of the ratios behind the different food building-blocks. I also feel that I have the theoretical background I need to begin making my own recipes.

A Related Work

I recently heard software engineer Jeff Potter on the radio program Science Friday talk about his book Cooking for Geeks: Real Science, Great Hacks, and Good Food. I have not read this book (I am ordering it now). From the interview, it sounds like this book was written in a similar vein to Ratio. If you are interested in the science of cooking as discussed in Cooking for Geeks, you can read the transcript here.

References

1. M . Ruhlman, Ratio : the Simple Codes Behind the Craft of Everyday Cooking, Scribner, 2009. ISBN-10: 1416566112

2. J. Potter, Cooking for Geeks: Real Science, Great Hacks, and Good Food, O'Reilly, 2010. ISBN-13: 978-0596805883

Posted in Baking | Comments Off on Book Review: Ratio by Michael Ruhlman

The Case of the Mysterious Bit Errors

Introduction

I am the hardware director for a team of optical networking professionals. More often than I care to admit, we need to embark on a detective case in order to resolve a customer problem. This blog describes a situation that occurred recently where a little math shed some light on the problem.

The Problem

We recently had reports from the field of bit errors occurring in the mornings and evenings at a newly deployed site in Mexico. Our customers use bit error rate as a measure of the quality of service they are receiving. In this case, our bit error rate should have been zero. The bit errors were disturbingly like some reports we had received during the previous spring from a deployment in North Dakota. The bit errors in North Dakota vanished before we were unable to find their root cause. We have hundreds of sites that use our hardware without any bit errors occurring at all — What was common between two sites in Mexico and North Dakota that would cause bit errors in our system?

Clues

As we asked our field engineers questions, some clues emerged:

  • There are two types of fiber deployment: aerial and buried. Each of the problem sites involved aerial fiber deployments. In an aerial deployment, the fiber is hung from poles instead of being buried in the ground. We have large numbers of both types of deployments.
  • The North Dakota, the bit errors had only occurred in the spring, while the bit errors in Mexico were occurring in the summer.
  • In both cases, the errors occurred at sunrise and in late afternoon.
  • The fiber runs were long — 11 km or longer. While our system is certified to 60 km, over 80% of our deployments have ranges of 5 km or less.
  • The bit errors were not randomly placed. They occurred in specific areas at the end of long data sequences.

Formation of Hypotheses

Here is where problem-solving experience is useful. We start with some inferences based on our experience.

  • We know that the maximum temperature changes in an aerial deployment occur in the morning at first exposure to sunlight and late in the afternoon.
  • Our experience is that both North Dakota and Mexico experience fast changes in temperature. While their temperatures are different, both regions have similar rates of temperature change.
  • Our experience has been that bit errors at the end of long data sequences almost always meant that there was a timing problem.

Could we be experiencing a temperature-dependent timing problem? Our system depends on precise timing for reliable data transmission. We adjust for timing changes periodically, but between adjustments the system timing (i.e. arrival time of photons at a receiver) must remain constant within ±19.2 nsec for reliable data transmission.

Could rapid temperature changes be causing the transmission time of our signal be varying on the fiber enough to cause bit errors? We do periodically check the system timing to adjust for slow-moving timing changes. However, what if a change in timing occurs so quickly that our current approach cannot adjust fast enough? That could cause this problem.

Testing Our Hypothesis

We used a two-prong approach to test our hypothesis:

  • Insert a change into our programmable hardware (i.e. Field Programmable Gate Arrays [FPGA]) that would allow our system in Mexico to work with larger delay variation. If increasing our tolerance for delay variation reduced or eliminated the bit errors, we would know that timing was at the heart of the problem.
  • Begin a detailed look at the effect of temperature on the signal delay variation with temperature on fiber. This would tell us the amount of timing variation that the system must be designed to handle. During our early development, we had made assumptions about how fast the temperature could vary. Maybe the temperature was varying faster than we assumed?

When we made the change to our system in Mexico, the bit errors went away. This gave us empirical evidence that timing was the culprit. Now we needed to determine if the signal delay on the fiber was varying enough to cause a problem. Ideally, we would have many kilometers of fiber in our lab that we could use to make direct measurements of the signal delay variation with temperature. Unfortunately, we had neither the fiber nor the required temperature chambers to make these measurements. So we decided to try to alternative approaches: web searching for published fiber delay versus temperature data and mathematical modeling.

The web searching provided some data. Specifically, one reference from the power industry [1] stated that they had measured \left( {~80 \pm 20} \right)\frac{{{\text{ps}}}}{{{\text{km}} \cdot ^\circ {\text{C}}}} . However, they were using cables that were constructed very differently from hours. The power industry data was for massive cables that had large steel reinforcing members. My concern was that the fiber transmission speed is a function of the tension on the fiber and I am quite certain the tension on our cables is different than theirs.

Maybe some mathematical modeling could provide some insight into the critical variables? We proceeded as shown below.

How Does Signal Speed Vary on a Fiber with Temperature?

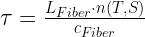
We begin by looking at what determines the signal transmission time on a fiber. The transmission time is simply distance divided by the speed of light on the cable.

\tau = \frac{L_{Fiber}}{c_{Fiber} }

Where \tau is the signal transmission time on the fiber, L_{Fiber} is the distance between the light transmitter (a laser) and the light receiver, and c_{Fiber} is the speed of light on the fiber.

The speed of light on the fiber is given by the following expression.

c_{Fiber} = \frac{c}{n}

Where c is the speed of light in a vacuum and n is the fiber's index of refraction. It turns out that n is a complicated term — it is a function of both temperature (T) and mechanical stress (S).

We can combine these expressions as follows.

\tau = \frac{L_{Fiber} \cdot n(T,S)}{c_{Fiber} }

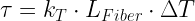
Now we can apply a little calculus to determine how this delay varies with temperature. We can take the derivative of this expression with respect to temperature T and obtain the following result (note that c is a constant).

c_{Fiber} \cdot \frac{{d\tau }}{{dT}} = \frac{{d{L_{Fiber}}}}{{dT}} \cdot n + {L_{Fiber}} \cdot \left( {\frac{{\delta n}}{{\delta S}} \cdot \frac{{dS}}{{dT}} + \frac{{\delta n}}{{\delta T}}} \right)

We can rearrange this expression to make it a bit more useful for the discussions to follow. These expressions are formed to use readily available physical data for fiber.
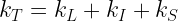
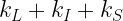
d\tau  = \left( {\frac{{\frac{{\frac{{d{L_{Fiber}}}}{{dT}}}}{L} \cdot n}}{c} + \frac{{\frac{{\delta n}}{{\delta S}} \cdot \frac{{dS}}{{dT}}}}{c} + \frac{{\frac{{\frac{{\delta n}}{{\delta T}}}}{n} \cdot n}}{c}} \right) \cdot {L_{Fiber}} \cdot d\tau

Where k_T is the overall temperature coefficient of the fiber delay. A few definitions will simplify our look at each term of the temperature variation independently.

Components of Temperature-Induced Delay Variation
Delay Component Equation
Fiber Length-Related Change {k_L} \triangleq \frac{{\frac{{\frac{{dL}}{{dT}}}}{L} \cdot n}}{c}
Index of Refraction-Related Change with Temperature {k_I} \triangleq \frac{{\frac{{\frac{{\delta n}}{{\delta T}}}}{n} \cdot n}}{c}
Index of Refraction Changes with Temperature-Induced Stress {k_S} \triangleq \frac{{\frac{{\delta n}}{{\delta S}} \cdot \frac{{dS}}{{dT}}}}{c}

Using these definitions, we can now write a simple expression for the variation of signal delay on the fiber.

{k_T} = {k_L} + {k_I} + {k_S}

We can now discuss the overall delay variation in terms of the variation of each of the components.

d\tau  = \left( {{k_L} + {k_S} + {k_I}} \right) \cdot L \cdot d\tau

Temperature Variation of the Components of Signal Delay

Key Fiber Characteristics

Before we go too far, we need to list out some of the key physical characteristics of fiber optic cable. These characteristics vary a bit from manufacturer to manufacturer, but these values are representative.

Table of Important Fiber Physical Characteristics
Parameter Description Value Units
n Silica Index of Refraction 1.455 dimensionless
{\frac{{\frac{{\partial {L_{Fiber}}}}{{\partial T}}}}{{{L_{Fiber}}}}} Temperature Coefficient of Fiber Length 5.5E-7 1/°C
\frac{{\frac{{\partial n}}{{\partial T}}}}{n} Temperature Coefficient of Index of Refraction 9.76E-6 1/°C
p11 First Pockel's constant 0.113 dimensionless
p12 Second Pockel's constant 0.252 dimensionless
ν Poisson's Ratio 0.16 dimensionless

A Brief Look at the Photoelastic Effect

It turns out the effect of stress on the fiber is difficult to model. While there is a good theory for the fiber by itself, the fiber is bundled in other materials that have their own expansion coefficient. Thus, the overall stress on the fiber is a complex function of the constituent material properties. We can compute the photoelastic variation in the index of refraction for unsheathed fiber using the equation shown below.

{k_S} \triangleq \frac{{\frac{{\delta n}}{{\delta S}} \cdot \frac{{dS}}{{dT}}}}{c} = \frac{{{n^3}}}{2}\cdot\left[ {\left( {{p_{11}} + {p_{12}}} \right)\cdot\nu  - {p_{12}}} \right]\cdot\frac{\alpha }{c}

The analysis that follows will model the photoelastic variation of the fiber itself, but it will not attempt to model the total variation in the index of refraction due to stress — we simply do not have enough information. Similarly, while we have data for the temperature coefficient of expansion for silica, we do not have data on the specific cable being used in Mexico or North Dakota. So our modeling will be rough for two of the three terms. This means that we should treat our mathematical analysis as giving us an order of magnitude result that may not be exactly correct. It will tell us what are the most important terms.

Summary of Delay Coefficients

Calculation of Delay Variation Due to Length Change
Symbol Equation Value Unit
kL \frac{{\frac{{\frac{{\partial {L_{Fiber}}}}{{\partial T}}}}{{{L_{Fiber}}}}}}{c} \cdot n

2.67 \frac{{{\text{ps}}}}{{{\text{km}} \cdot {^{\circ}\text{C}}}}
kI \frac{{\frac{{\frac{{dn}}{{dT}}}}{n} \cdot n}}{c}

47.42 \frac{{{\text{ps}}}}{{{\text{km}} \cdot {^{\circ}\text{C}}}}
kS \frac{{\frac{{\partial {n_S}}}{{\partial T}}}}{{{n_S}}} -0.55 \frac{{{\text{ps}}}}{{{\text{km}} \cdot {^{\circ}\text{C}}}}
kT {k_L} + {k_I} + {k_S} 49.54 \frac{{{\text{ps}}}}{{{\text{km}} \cdot {^{\circ}\text{C}}}}

We see that the delay variation is dominated by the temperature coefficient of the index of refraction. So we should expect to see ~50 \frac{{{\text{ps}}}}{{{\text{km}} \cdot {^{\circ}\text{C}}}} for the fiber itself. However, Reference [1] reports larger values for the delay variation with temperature. My assumption is that this variation is due to the change in mechanical stresses with temperature, which I have not modeled. They are considered in [3], but that is way beyond my scope here. So 50 \frac{{{\text{ps}}}}{{{\text{km}} \cdot {^{\circ}\text{C}}}} should be looked upon as a lower bound. For the sake of further analysis, we will assume a delay temperature coefficient of \left( {~75 \pm 25} \right)\frac{{{\text{ps}}}}{{{\text{km}} \cdot ^\circ {\text{C}}}} .

Estimate of Total Delay Variation

If we assume a temperature variation of 30 °C, we can estimate the total delay variation using the following equation.

\tau  = {k_T} \cdot {L_{Fiber}} \cdot \Delta T

We can substitute the values from our Mexican deployment into this equation to obtain.

\tau = 75\frac{{{\text{ps}}}}{{{\text{km}} \cdot {^\circ \text{C}}}} \cdot 11{\text{ km}} \cdot \text{30 } ^\circ \text{K}  =  \text{25.750 ns}

This shows that the delay variation with temperature larger than our limit of 19.2 nsec and is sufficient to cause bit errors.

Comparison With Published Results

I was not able to find a large number of references on the variation in signal delay with temperature but there were two that were useful. One reference [1] stated that they had observed a fiber delay variation in the range of 60 to 100 \frac{{{\text{ps}}}}{{{\text{km}} \cdot {^\circ \text{C}}}} . This is consistent with what we were seeing. Another reference [2] states that the fiber delay variation is 43 \frac{{{\text{ps}}}}{{{\text{km}} \cdot {^\circ \text{C}}}} . This is less than my estimate, but still enough to cause a failure given a long fiber, large temperature variation, or both.

Conclusion

Here is how everything ended up:

  • We modified our system to meet a maximum fiber delay variation of 100 \frac{{{\text{ps}}}}{{{\text{km}} \cdot {^\circ \text{C}}}} .
  • Thanks to programmable hardware, we were able to download the change to our customers at no cost.
  • The problem has not reappeared. This is the best indication of all that we nailed the bug!

References

[1] Myoujin, Y.. "Transmission delay variations in OPGW and overhead fiber-optic cable links ." IEEE Transactions on Power Delivery 12, no. 4 (1997): 1415-1421.
[2] Nooren, G-J. "Influence of temperature and pressure on light propagation in fibres." June 6, /2000.http://www.nikhef.nl/~nooren/fibretest/ (accessed March 21, 2010).
[3] Kiesel, S et al. "Behaviour of intrinsic polymer optical fibre sensor for large-strain applications." Measurement Science and Technology 18 (2007) 3144–3154.

Posted in Fiber Optics | 1 Comment

Another Interview Question

Besides me, there is one other engineer in my group that used to work for Hewlett-Packard back in the old days. One day we decided to compare notes on the crazy interview questions that we were asked all those many years ago. During the discussion, I recalled one question that I have seen only once since my interview (~30 years ago). It is worth writing down here.

A young electrical engineer is handed two boxes, one labeled A and the other labeled B. It is known that one contains a Norton equivalent circuit and the other contains a Thevenin equivalent circuit (see figure below).

Norton and Thevenin Equivalent Circuits
Norton Equivalent Circuit Thevenin Equivalent Circuit
Norton Equivalent Circuit Thevenin Equivalent Circuits

The question for the young engineer is "What kind of circuit (Norton or Thevenin) is in box A and box B? How would you go about figuring out which box contains which equivalent circuit?"

The answer is there is no way using purely electrical test methods to determine what kind of equivalent circuit is in each box. So you need to look at other characteristics. Because the Norton circuit contains a current source, there is always a current flowing. This means that the box containing the Norton source will always be consuming power and generating a magnetic field. Most solutions are based on measuring power or magnetic field strength. The box containing the Thevenin circuit, with no load on its output, will neither consume power nor generate a magnetic field.

This is a nice problem in a number of ways. Correctly solving the problem demonstrates that the young engineer understands the important concept of equivalent circuits. It requires the young engineer to analyze a non-trivial problem while in a stressful situation. Also, it is convenient for an interviewer because it does not require any computation.

Posted in Interviewing, Problems | Tagged , , , , | 1 Comment

Fixing My Stairs Using Mathematics

The Problem

I am a VERY amateur carpenter, but I do love to build things out of wood. One particular specialty area of carpentry that I admire is stair building. I consider stair building (along with roof cutting) to be the brain surgery of carpentry. While occasionally stairs are works of art, they always must be safe and functional. Quite often, I see stairs where the height of either the bottom step or top step is not the same as the other stairs. This is nearly always because the flooring on the bottom or top floors has changed since the stairs were built. Unfortunately, I recently faced this same situation.

I live in a cold climate and my house has a basement. In order to make the basement livable in the winter, I hired a contractor to build an insulated floor, which is very thick compared with the original carpeting. Unfortunately, the additional lower floor height made the bottom step of my basement stairs very short. This created a safety issue and would be an issue if I were to try and sell the house. The city building inspector noticed the issue, but decided not to force the contractor to fix it. Given that option, the contractor left it short.

A few years after my basement floor was insulated, my wife and I decided to put a wood floor in the basement and re-carpet the stairs. Because the stair framework was exposed, this remodeling gave us an opportunity to equalize all the riser heights with minimal hassle. Unfortunately, we decided to equalize the riser heights the night before the carpet was due to go in. I contacted a carpenter for advice who said that I should just cut a new set of "stringers," which are the wooden supports that the treads sit on. This would not work, however, because the hour was late and I had neither the lumber nor the equipment to cut the stringers. After thinking about it a bit, the easiest solution was to use shims under each tread to set the unit rise for each tread. This is where a little bit of math came into play.

A Few Definitions

There are many special terms associated with the building of stairs. For this discussion, there are just a few terms that need to be defined. I have illustrated these terms in the following figure.

Illustration of a Few Stairway Terms

Illustration of a Few Stairway Terms

The situation that I faced was that my new insulated lower floor was now higher by 2.25 inches than when the stairs were originally built. The insulated floor was built using 2x4s (i.e. 1.5 inches thick) glued to my basement concrete surface to support a 0.75 inch thick floor surface made of plywood. Styrofoam insulation was placed between the plywood and the basement concrete surface. This was one of the best improvements I have made to my house, but it did raise my floor. The figure below illustrates the situation, along with some of the critical dimensions. Note that my actual stairs has many more treads than the four shown in this drawing but the drawing illustrates the problem just fine.

My Short Bottom Step Makes My Stairway Unsafe

The Fix

Let R be the unit rise before the floor height change, R' be the unit rise after the floor height change, T be the total rise before the floor height change, T' be the total rise after the floor height change, and N be the number of stairs. The unit rises before and after the floor height change are computed as follows.

{R} = \frac{T}{N}, {R'} = \frac{T'}{N}

Our objective here is to derive an expression for the thickness of each shim. In order to easily identify each individual shim height, we can assign a number to each stair tread — assign the bottom tread the number 1 and increment the number for each tread going up (top tread is actually the top finished floor and is assigned N). Each tread will be assigned a specific shim thickness. Let \tau_i be the shim thickness for the ith tread. For the sake of simplicity, we can define \tau_0 as the height increment of the newly finished lower floor height from the original floor height.

The following figure is useful in understanding the derivation of an expression for the shim thickness. It shows the relationship between the rise values before and after the shims.

Detail Drawing of An Individual Step

Using the figure above, we can see that the following relationship exists between R, R', \tau_{i} , and \tau _{i-1}.

R' + {\tau _{i - 1}} = R + \tau {}_i \Rightarrow R' = R + \left( {\tau {}_i - {\tau _{i - 1}}} \right)

Since each stair must be the same height and our overall stair height is shorter by \tau_0, the difference between the old and new stair heights must be {}^{{{\tau }_{0}}}\!\!\diagup\!\!{}_{N}\;. Given this difference, we can derive a relationship between the heights of the individual shims as follows.

R - R' = - \frac{{{\tau _0}}}{N} = \left( {\tau {}_i - {\tau _{i - 1}}} \right) \Rightarrow {\tau _i} = {\tau _{i - 1}} - \frac{{{\tau _0}}}{N}

This expression means that a shim's height is always \frac{\tau _0}{N} smaller than the shim on the next lower step.

Let's compute a few shim heights to illustrate the situation.

{\tau _1} = {\tau _0} - \frac{{{\tau _0}}}{N} = {\tau _0} \cdot \frac{{N - 1}}{N}

{\tau _2} = {\tau _1} - \frac{{{\tau _0}}}{N} = {\tau _0} \cdot \frac{{N - 2}}{N}

\vdots

{\tau _{N - 1}} = {\tau _0} - \frac{{\left( {N - 1} \right) \cdot {\tau _0}}}{N} = {\tau _0} \cdot \frac{1}{N}

{\tau _N} = {\tau _0} - \frac{{\left( N \right) \cdot {\tau _0}}}{N} = 0

There is a pattern here and the thickness of the ith shim is given by the following equation.

{\tau _i} = {\tau _0} \cdot \frac{{N - i}}{N}

We now have all the information we need to cut the shims and fix the stairs. Here is what the stairs looked like after the shimming was completed.

Shimming Equalizes All Unit Rises

My basement steps have been working without problems now for years. The unit rise of each step is exactly the same. All it ended up costing me was some scrap lumber, a little glue, and a little time to derive a solution. What more could I ask for?

Some Practical Issues

IRC Requirements

The main requirement of concern in this situation is the IRC constraint on the allowed variation in riser heights. To understand this requirement, consider the flight of stairs illustrated in the following figure.

Illustration of Riser Height Deviations

Illustration of Riser Height Deviations

The IRC requires that the following requirement be met.

\max \left( {{R_1},{R_2}, \cdots ,{R_{N}}} \right) - \min \left( {{R_1},{R_2}, \cdots ,{R_{N}}} \right)\; \leqslant \;\frac{3}{8}{\text{ inch}}

For more information on the IRC stairway requirement, see [1].

Dealing with Thin Shims

When I did my stairs, I worked too hard to make thin shims. If I had it to do over today, I would not have made any shims thinner than 1/8 inch. I would simply ensure that I met the IRC requirement that limits the maximum difference between riser heights to 3/8 inch. Making and installing thin strips is difficult because they are so fragile that they are not worth the effort.

A Reference with a Similar Approach

I did find one reference ([2]) that uses a similar method for fixing a flight of stairs, but the description is is not quite as detailed as presented here.

References

[1] "Visual Interpretation of the International Residential Code:2006 Stair Building Code", Stairway Manufacturers Association, 2006. Link
[2] B. Abernathy, "Q&A: Your Questions—Pro Answers: Fixing Rough Framed Stairs," Fine Homebuilding Magazine, Issue 168, pp. 106, Jan 2005. Link

Save

Save

Posted in Construction | 13 Comments

Why No More Bathyscaphes?

Introduction

Like many people, I have been watching BP try to cap the blown Deepwater Horizon oil well. While BP has had many issues, it has been very interesting watching the unmanned underwater vehicles (UUVs) do their job. When most people think of underwater vehicles they think of World War II submarines or one of the manned underwater vehicles that were used to explore Titanic. In today's world, most UUVs are busy quietly doing real work every day. Seeing these vehicles in action brought to mind some fond memories.

History

At one time in my career, I worked on UUVs and it was some of the most satisfying work of my career. I have always been fascinated by the history of undersea exploration. Most of this history has been about designing vehicles to take people to very inhospitable places. The topic of this article is the bathyscaphe, which is a manned vehicle that was designed to take people to the deepest depths. It is a vehicle of a time past.

My first and only direct contact with a bathyscaphe was on one of my business trips. While on a trip to Keyport, WA, I happened to stop by a wonderful museum, the Naval Undersea Museum. I highly recommend stopping by this museum if you have any interest in the sea. On this trip, I took particular note of their display of the bathyscaphe Trieste II. It is a heavily modified version of the Trieste I, the submarine that made the only manned trip to the deepest point in the ocean, Challenger Deep in the Marianas Trench. In fact, the Trieste II used the original pressure sphere from Trieste I, which is where the two-person crew resided while diving.

Bathyscaphe Trieste I

Wikipedia Photo of Trieste I

When I was a boy in the 1960s, I read about the bathyscaphe Trieste I and its brave crew, Jacques Piccard and Don Walsh. Their voyage had some scary moments, like when their glass viewing port cracked during the dive. If that port had let water in, there was no hope for their survival. However, they persevered and completed their mission. Their voyage also confirmed that life was present at the deepest point in the ocean. For those interested in more information on the mission, I recommend the Wikipedia’s exposition. There is also a very interesting web site that specializes in the Walsh/Piccard mission

How a Submarine Works

A typical submarine that works at relatively shallow depths usually has ballast tanks that can be filled with water. A submarine dives or surfaces by applying Archimedes' Principle, which states that an object sinks or floats based on its density relative to water. In the case of a submarine, as the ballast tanks fill with water, the submarine density of the submarine increases and it dives. To rise, compressed air is used to clear the tanks of water. As the water is removed, the density of the submarine decreases, and the submarine surfaces. The problem with this approach for an underwater vehicle is that the ballast tanks must be built sturdy enough to ensure that the pressure outside the tanks cannot crush them. This means big, heavy, and expensive tanks.

How a Bathyscaphe Works

A bathyscaphe works differently than a submarine. Because it works at extreme depth, the only air spaces on the vehicle are for the crew. From a buoyancy standpoint, a bathyscaphe is similar to a hot air balloon in that it uses contains a buoyant fluid (aviation fuel) in a lightweight enclosure to provide lift. The nice thing about aviation fuel is that it is incompressible and that means that it will resist the intense pressure. To sink, a bathyscaphe is filled with aviation fuel for buoyancy and iron shot for ballast. Enough iron shot is put on-board to ensure it can dive. When the bathyscaphe wants to surface, it releases the iron shot. To quote the Wikipedia, "Strictly speaking bathyscaphes are not submarines because they have minimal mobility and are built like a balloon, using a habitable spherical pressure vessel hung under a liquid hydrocarbon filled float drum." The following figures from Wikimedia Commons do a nice job illustrating how a bathyscaphe works.

Wikipedia Cutaway Drawing of the Trieste I

Wikimedia Commons Image of Bathyscaphe in Action

Why No More Bathyscaphes?

While bathyscaphes are interesting, no one builds them anymore. Why? I am an electrical engineer by training, but I was very curious about how these research vessels are designed. As part of my job, I worked with an excellent team of mechanical engineers that were designing the structures (pressure vessels, control surfaces, etc) for the underwater vehicles we were building. So I decided to ask the lead engineer of this very knowledgeable group "Why no more bathyscaphes?" He gave me a two-word answer ― "syntactic foam". A syntactic foam is basically a plastic material that is filled with a large number of tiny hollow spheres. The spheres can be made of various materials. In my case, they were glass. These spheres are very strong so that they can resist extreme pressures. They are also very light and easy to work with. They also provide a substantial amount of buoyancy. The polymer material binds all the spheres together; hence the term "syntactic," which means to "put together." The vehicles we were working on had a lot of foam. I noticed that all modern deep-diving submarines use syntactic foam (see Alvin for example). Now I understood why no one builds bathyscaphes anymore -- the foam is much cheaper and more convenient than aviation fuel when it comes to flotation. More importantly, it is also much safer because gasoline can leak from the tanks (see Bob Ballard story below).

Underwater Adventure

I have heard syntactic foam and bathyscaphes mentioned in the news.

Bathyscaphes in the News

Do not ever pass up an opportunity to hear Bob Ballard speak on science. He is absolutely the best. I was listening to him on the radio one day and he told a hair-raising story about a trip he took on a bathyscaphe. While down deep, a leak developed and the gasoline began to leak out. Now think about this ― the gasoline is like the hot air in a hot air balloon. If the hot air leaks out of a balloon you sink to the ground. If the gasoline leaks out of a bathyscaphe, you sink to the bottom of the ocean. Ballard related how they sweated out the long trip back to the surface hoping that they would have enough gasoline to get them to the surface. If they were to leak gasoline too quickly, they would end up on the bottom of the ocean — and no one else could dive deep enough to help recover them. Fortunately, everything worked out. But this illustrates how dangerous undersea exploration was in the early days. Here is a link to a PBS video where he relates the same story.

Syntactic Foam in the News

It may be hard to believe, but I actually heard a scientist on a documentary talking about syntactic foam. He was serving on the Alvin when it filmed vulcanism down at the mid-Atlantic ridge. The scientist was actually on the submarine and was reading the temperature of the water outside. As the temperature rose, an engineer mentioned to him that the outside temperature was hot enough to melt the syntactic foam and they should get to a cooler area. The scientist immediately agreed and they pulled out of that area.

On May 31, 2009, the robot submarine Nereus went to the bottom of Challenger deep. The craft they sent used a new kind of buoyancy system using ceramic spheres in place of syntactic foam.

Web References to the Dive

Posted in Underwater | Tagged , , | 3 Comments