Quote of the Day
I feel like a broken record talking to a brick wall.
— Engineer tired of telling executive management the same thing over and over.
Introduction
An circuit designer came to me yesterday with an interesting problem whose solution nicely illustrates how simple component thermal calculations are performed. He was seeking advice on calculating the junction temperature of a Schottky diode (Figure 1) used in a switched-mode power supply.
At our company, the component temperature calculations are done by a mechanical engineer rather than by the circuit designer. Junction temperature calculations performed by the mechanical engineer showed that the diode was operating way above its allowed maximum temperature. This means that the circuit designer was being told to add a costly heat sink and make time-consuming Printed Circuit Board (PCB) design changes. We have not needed to take these actions for similar circuits in the past, and he was wondering if there could have been a modeling issue.
In this post, I will document my analysis of the diode's temperature. It turns out that the diode's temperature is within the allowed limits and there was a modeling issue – the wrong thermal resistance value was used. It was just a simple miscommunication that resulted in unnecessary engineering actions being requested.
Background
Definitions
All the term definitions (with one exception) used for this post are contained in two previous posts:
A previously unmentioned thermal resistance, θJL, is used in the following analysis. θJL represents the thermal resistance between the diode junction and its leads. This type of thermal resistance specification is common for power components.
A Modeling Warning
The modeling error that initiated this additional calculation was the inappropriate use of θJA. I almost never use θJA directly for determining junction temperature. I will quote from the JEDEC standard on its recommendation for the use of θJA – the standard uses the term "Theta-JA."
The intent of Theta-JA measurements is solely for a thermal performance comparison of one package to another in a standardized environment. This methodology is not meant to and will not predict the performance of a package in an application-specific environment.
Ignoring this statement was at the core of the modeling error.
Difference Between Case Temperature and Lead Temperature
Figure 2 shows where the lead temperature is to be measured. Power components often have a large copper "slug" – also known as the lead – that is intended to provide an excellent thermal conduction path to the PCB.

Figure 2: Illustration showing how lead temperature is defined. (Source)
Unfortunately, case temperature measurements are standard practice because it is easier to attach a thermocouple to the case than to a tiny tab.
Analysis
Junction Temperature Estimate Using θJL
The key formula for this calculation is Equation 1.
| Eq. 1 |
 |
where
- TB is the PCB temperature. I normally assume that TB is 10 °C above the air ambient temperature of 70 °C – set by industry standard.
- PDiode is the power dissipated in the diode, which is 2.5 W in this application.
- θJL is thermal resistance from Junction-to-Lead, which is 3 °C/W for this diode.
- TJ is the diode junction temperature. By company convention, we normally limit TJ to no higher than 110 °C. This convention dates back to my days as a Navy contractor when we were required to conform to the Willoughby reliability guidelines, which strongly recommended keeping junction temperature under 110 °C. I should mention that the part is designed to function at temperatures as high as 150 °C. We would never run a part this hot because the lifetime is reduced at this temperature below our customer's expectations (15 years). If you are curious about modeling component failure rate with respect to temperature, see this post on laser reliability modeling.
Figure 3 shows the computation details.

Figure 3: Computing the TJ Using θJL.
I estimate the junction temperature to be running near 88 °C. This compares well with testing done with similar circuits on previous products.
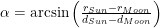
Junction Temperature Estimate Using Estimated ψJT
Just to provide folks an alternative approach to the calculation, there is a parameter called ψJT that is actually more appropriate for this calculation. We can use Equation 2 and ψJT to compute TJ. I derive this formula in gruesome detail in this blog post.
| Eq. 2 |
 |
where
- TT is the temperature measured at the top of the diode case. In this situation, I measured 88 °C.
- ψJT is thermal resistance from Junction-to-Top of case.
Unfortunately, the diode vendor does not provide ψJT. However, there Equation 3 can be used to estimate ψJT sufficiently well for many applications.
| Eq. 3 |
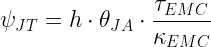 |
where
- h is the heat transfer coefficient of air.
- τEMC is the thickness of the part's Epoxy Molding Compound (EMC).
- κEMC is the thermal conductivity of the part's epoxy molding compound.
- ψJT is thermal characteristic from Junction-to-Top of case.
- θJA is the thermal resistance from Junction-to-Ambient.
Figure 4 shows how I computed ψJT and used it to compute TJ.

Figure 4: Junction Temperature calculation using ψJT estimate.
The use of the approximate method also yielded a junction temperature estimate of ~90 °C. The erroneous calculation using θJA produced a temperature estimate that was over 140 °C.
Conclusion
While going through my calculation, I saw where the error occurred in the other engineer's analysis. I then sent him a copy of my work, and we avoided making a costly change to a system. I posted this example because others might find it useful.
I should mention that this is a simple one-resistor analysis that is not particularly accurate – the answer should be viewed as rough. When more accurate answers are required, engineers need to turn to Delphi models (i.e. multi-resistor) or computational fluid dynamics software.