I Am Now A Grandpa

Quote of the Day

I can be President of the United States or I can control Alice. I cannot possibly do both.

Theodore Roosevelt, answering a question about his wild eldest daughter Alice.


Figure 1: Picture of My Granddaughter.

Figure 1: Picture of My Granddaughter.

I am bursting with excitement right now. My youngest son and his wife now have a little girl. The baby arrived about 3 weeks early, but both mother and baby are doing fine. I could not be happier for their family.

I find the whole process of having a child amazing:

  • Before they arrive, you have never met them and could not love them more.
  • After they arrive, life becomes a blur of love, work, and worry.
  • When they leave home, you find yourself wishing you could have some of the old days back.
Figure 2: Beautiful Eyes.

Figure 2: Beautiful Eyes.

Unfortunately, my son and his wife live 1000 miles away in Montana. The drive to Montana is a long one and can be dangerous during the winter –North Dakota blizzards are brutal. Air service to Western Montana is expensive and inconvenient (i.e. connections through Denver or Salt Lake City).

One way or another, I am going to be spending much more time in Montana.

Figure 3: One Month Old.

Figure 3: One Month Old.

Figure M: Three Months Old and Smiling.Figure M: Three Months Old and Smiling.

Figure 4: Three Months Old and Smiling.

Figure 5: Six Months and Rocking It.

Figure 5: Six Months and Rocking It.

Save

Save

Save

Save

Save

Posted in Personal | 5 Comments

Excel Data Table with More Than Two Input Variables

Quote of the Day

Half-truths are like half a brick - they can be thrown farther.

— Hyman von Rickover


Introduction

Figure 1: Example of a 3-Input Variable, 4-Output Variable Data Table.

Figure 1: Example of a 3-Input Variable, 4-Output Variable Data Table.

I am a big fan of Excel data tables, but I often struggle because they are designed to work with one or two input variables and a single output function. Many of calculations that I do have more than two input variables. These calculations also often have multiple output values. This post discusses how to create a data table with more than 2 input variables and more than one output variable.

I often use this type of table when I am verifying my Excel formula implementation against a reference. Figure 1 shows a typical example. I needed to compute the air density, dew point, humidity ratio, and enthalpy for multiple combinations of three input parameters: air pressure, relative humidity, and temperature (°F). I can now check these results against a reference table.

I give links to two examples at the bottom of this post.

Illustration

Figure 2 shows an example of how I layout the data table. Here are the key features:

  • Create a data table with sequentially numbered row and column values.
  • The data table column input is in C45 (red).
  • The data table row input is in C44 (blue).
  • The output is selected from D34:D37 (green).
  • The input parameters are selected based on the row input variable.

You can use either INDEX or OFFSET functions to implement the data table. I prefer the INDEX function because it is not volatile.

Figure 2: Annotated 2-Dimensional Table.

Figure 2: Annotated 2-Dimensional Table.

 Examples

Here are two recent examples of this type of data table that I used to verify my implementation of some formulas. I should note that I spend quite a bit of time checking my Excel spreadsheets – errors are just too easy to make.

Save

Posted in Excel | 2 Comments

Tree Felling Miracle

Quote of the Day

Happiness in intelligent people is the rarest thing I know.

— Hemingway. I also have much anecdotal evidence for the truth of this statement.


I have seen a number of people fell trees onto homes and cars. Here is one case where two good-ol' boys dropped one  successfully.

Figure 2: Incredible Skill/Luck in Dropping This Tree Exactly Where it Needed to Go.

One of the engineers on my team sent me this. She was amazed that they were able to pull this off.

A former neighbor of mine once dropped a tree onto another neighbor's house. He carefully tied off the tree to a car bumper using an inadequate rope to keep the tree from falling onto the neighbor's house. He then proceeded to cut the tree on the wrong side. Of course, the tree started to fall in the wrong direction and the rope gave way. All you could do is stand there and watch in stunned disbelief.

Posted in Humor | Comments Off on Tree Felling Miracle

What R-Value Is Good Enough?

Quote of the Day

If everything seems under control, you're not going fast enough.

- Mario Andretti, race car driver. I feel the same way about the fiber optic business.


Introduction

Figure 1: My New Garage Will Be Similar to This Building.

Figure 1: My New Garage Will Be Similar to This Building.

I plan on retiring at my lake home in Northern Minnesota. The first step in my retirement preparations is building a large garage on my retirement property that will allow me to work on my various projects – I have not mentioned it before, but I love doing auto body work. I am currently building a garage similar to that shown in Figure 1. Because northern Minnesota is quite cold in the winter, I needed to insulate and heat this structure. I also, however, will need to consider airflow in this calculation as otherwise there could be a risk of mold developing in the property, which would then require a mold remediation service to remove. With that in mind, this post will review some observations that I made as to the value of insulation and of using modern ventilation systems with heat recovery capability.

This blog post will show the impact on my January garage heating bill for different ceiling and wall insulation R-value options, subject to different ventilation assumptions. Whatever lesson you take from this post remember that no matter where you are living having the proper heating equipment is essential, this includes water heaters too as during the colder months pipes can freeze causing recurring issues, but with the correct services and installations from companies like Morris Jenkin homeowners like me can keep their homes toasty all the time.

The analysis presented in this blog post is captured in this Excel workbook. There is a small macro in this workbook that is used to select between the different ventilation scenarios. The model includes windows and can easily be modified to accommodate different size buildings and window configurations.

Background

Definitions

ACH50
The number of air changes per hour with the home pressurized 50 Pa above outside air pressure. This measurement is usually made using a blower door.
ACHNatural
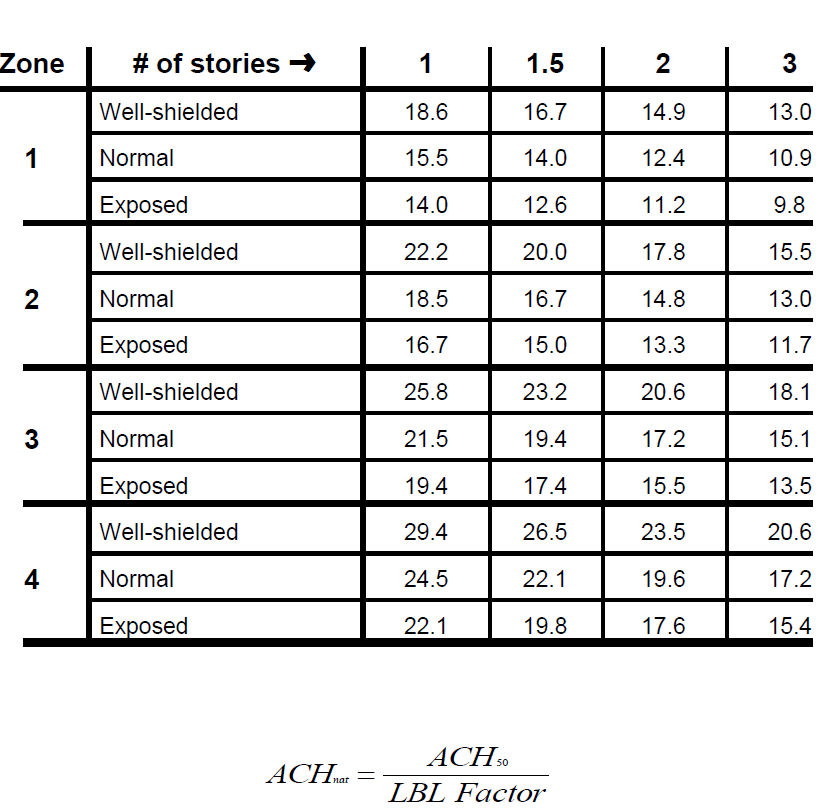
The rate of air changes assume normal air home pressures. The value normally has to be estimated (example calculation). For this post, I will assume that the ACHNatural is 1/20th of the ACH50 value, which is a common assumption. The Energy Star folks publish their calculation recommendations in this document, which have different factors for different conditions. Here is another good reference. I include the Energy Star table in Appendix A. Here is a simple web calculator that guides you through their table.

Technical Information

All the engineering needed to understand this analysis is presented in these blog posts:

Analysis

Leaky House Case

Figure 2 shows my estimated monthly garage heating bill assuming (1) typical January temperatures, and (2) a very leaky structure. The key observation to make about this graph is that using extreme levels of insulation make relatively little impact on the heating bill because of all the air leaking away through the walls and ceilings.

Figure 2: Leaky Building (ACH=10).

Figure 2: Leaky Building (ACH50=10).

I should note that I did not worry about ventilating the garage in this case because the structure is so leaky that no ventilation is necessary.

Moderately Air-Tight House Case

In Figure 3, I halved the leakage rate of the structure and observe that insulation levels have a bit more effect, but most of my money is still leaking through the walls and ceiling.

Figure 3: Moderately Tight Building (ACH=5).

Figure 3: Moderately Tight Building (ACH50=5).

Air-Tight House with Ventilation Lacking Heat Recovery

In Figure 3, my garage is so air-tight that the building code requires that I have ventilation. In this case, my ventilation level is less than the leakage levels of Figure 2 and 3, so my monthly bill drops and I can see that increasing my ceiling insulation level is certainly starting to save me money.

Figure 3: Tight Building (ACH50=1) with Ventilator Lacking Heat Recovery.

Figure 4: Tight Building (ACH50=1) with Ventilator Lacking Heat Recovery.

Air-Tight House with Ventilation with Heat Recovery

Figure 5 shows that building an air tight garage with a heat recovering ventilator makes a big difference in the the monthly cost of heating the garage. The chart also shows that increasing the ceiling insulation levels of R38+ and wall insulation levels of R20+ make a big difference in the monthly cost.

Figure 5: Tighter Building (ACH50=1) With Ventilator Using Heat Recovery.

Figure 5: Tight Building (ACH50=1) With Ventilator Using Heat Recovery.

In fact, my garage will have a ceiling insulated to R38 and walls to R18. I would expect it to cost ~$250 to heat for the month of January in Minnesota.

During retirement, I hope to be living in Florida during December, January, and February 🙂 Northern Minnesota is too cold for me to consider living there year-round. During my absence in the dead of winter, I plan to keep the garage just warm enough to prevent frost heave.

Conclusion

This exercise made clear to me that need for heat recovering ventilators in a tightly-built home. Every home needs ventilation for the health of the occupants. Ventilation becomes the major source of energy loss when your home is well-insulated. Thus, it behooves you to do everything you can to recover all the energy you can from the stale air before you vent it outside.

I should mention that my wife has expressed concern that she will never see me again once the garage is built and all my toys are in there. She may be right ...

Appendix A: Energy Star ACHNatural Estimation Method.

Figures 6 and 7 shows the ACHNatural estimation method recommended by the Energy Star folks. Figure 6 shows how to evaluate the wind zone parameter.

Figure M: Wind Zone Reference Map.

Figure 6: Wind Zone Reference Map.

Figure 7 shows how to determine the divisor – Energy Star calls it the LBL factor. I used 20 for my rough analysis. I believe that LBL stands for Lawrence Berkley Labs, but I have not confirmed this.

Figure M: Energy Star Calculation Recommendations.

Figure 7: Energy Star Calculation Recommendations.

Save

Save

Save

Posted in Construction | 4 Comments

Fighter Plane Statistics

Quote of the Day

A mathematician is a person who can find analogies between theorems; a better mathematician is one who can see analogies between proofs and the best mathematician can notice analogies between theories. One can imagine that the ultimate mathematician is one who can see analogies between analogies.

— Stefan Banach


Introduction

Figure 1: F4 Phantom. (Source)

Figure 1: F4 Phantom. This aircraft has the most
kills of any active jet fighter. (Source)

I was reading  a post on Quora that contained the following statement fragment, "…  primarily the F16[,] which has more kills than any fighter jet in history."  The statement did not seem like it could be correct because the operational tempo of modern air-to-air operations is not like it was during the Vietnam War or the various Middle East conflicts (e.g Iran-Iraq War).

So I prowled around the web and found a site that seemed to have some good information on the combat history of active jet fighters, including the F-16. I thought I would use this question as a vehicle for sharpening my Power Query and Excel web scraping skills by making a comparison table between the active duty fighter jets.

Background

All the data for this post came from this web site. I did find a couple of inconsistencies in the data the listed loss totals for the MiG-21, MiG-23, and Mirage F1 were off a small amount from the sum of the individual battle totals. I used the sum of individual battle totals here.

Analysis

I used Power Query to access the data and clean it up. I then used a pivot table to summarize the results. If you are interested in my workbook, I include it here. Because there was so much uncertainty in the data for ground losses, I did not include that data in the table.

Here are my results. As I suspected, the list is led by a couple of old warhorses, the F-4 and the MiG-21. The F-16 is sixth on the list.

Figure 2: Table of Fighter Victories and Losses.

Figure 2: Table of Fighter Victories and Losses.

Conclusion

There are some additional observations we can make about this data:

  • Most of the F-14's combat kills came when it was used by Iran in the Iran-Iraq War.  Of the 135 kills, only 5 involved the US.
  • While not shown in Figure 2, the F-4 suffered 545 losses due to ground fire, 447 of which were during the Vietnam War. This is far more than were lost in air-to-air combat. I assume most of these losses were on ground attack missions – very difficult work.
  • While the Sea Harrier is considered a ground attack aircraft, its record of 21 kills with no losses in the Falklands War shows that it has some air-to-air capabilities. I am sure that the superb training of the Fleet Air Arm pilots has much to do with this record. The Harrier has some unique capabilities (e.g. viffing) that may be useful in some combat situations (commentary).
  • The kill-to-loss ratio for the MiGs does not appear to be very good. However, most of these losses involved non-Russian pilots flying export versions of these craft. I could not find data involving only Russian pilots.
  • The newest fighters have not been tested in combat yet (thankfully). This set includes:
Posted in History Through Spreadsheets, Military History | Comments Off on Fighter Plane Statistics

Using Excel's Icon Sets for Testing Equality -- Ugh

Quote of the Day

The greatest mistake we make is living in constant fear that we will make one.

— John Maxwell


Introduction

Figure 1: Standard Icon List Choices.

Figure 1: Standard Icon List Choices.

I use Excel everyday, but that does not mean that I have used every feature. Yesterday, I was asked to prepare an analysis for our marketing group of the maximum possible distances over which a customer can be served using various types of fiber optic communication systems – we call this parameter "reach". During this analysis, I saw what I thought was an ideal opportunity to use Excel's icon sets for the first time (Figure 1).

I was simply going to generate a check mark if two figures agreed and an X if two figures disagreed – there are many ways to accomplish this task, but I decided to try something new today. What appeared to be a simple application ended up being more difficult than I thought it should be. In this post, I will show how I resolved the issue.

A sample workbook is included here.

Background

When I do analysis work using a spreadsheet, I like to include some side calculations that I call "check figures", which are non-essential calculations that provide indications that my overall calculations are at least consistent with each other. I include check figures in all my critical spreadsheet work because it is so difficult to catch spreadsheet errors. To remind me of how difficult it is to catch spreadsheet errors, I keep a list of disasters caused by spreadsheet errors (e.g. a spreadsheet error was at the heart of the London Whale incident). The problem of spreadsheet errors has even been discussed in the New York Times. Of course, simple math errors plague even peer-reviewed research papers.

To improve the quality of my spreadsheet work, I keep a close watch on the work of the Spreadsheet Lab at Delft University. These folks are at the cutting edge of helping spreadsheet users improve their quality. For a good presentation on their work, see the video in Figure 2.

Figure 2: Good Video Briefing on Spreadsheet Work.

Application

Problem Description

I want to indicate that two cell are either equal or different using a check mark or "X", respectively, which I illustrate in Figure 3.

Figure 3: Example of My Desired Output.

Figure 3: Example of My Desired Output.

Issues

There were two issues that I encountered while trying to perform this simple task:

  • I could not use relative addressing.
    I was floored to find out that I could not simple point at the reference cell to which I wanted to compare my cell contents. I was able to solve this problem by using the offset function to create a reference without any relative addressing (Figure 4). I should mention that I try not to use the offset function as a matter of principal because it is volatile. I will experiment with using non-volatile functions (e.g. Index) later.

    Figure 3: Cell Reference with No Relative Addressing.

    Figure 4: Cell Reference with No Relative Addressing.

  • I could not simply copy the format from the first item to all others.
    I had to copy the format from the first cell (C9) to all others one at a time. What a pain!

Icon Set Dialog Configuration

Figure 5 shows my Icon Set dialog box configuration. My logic is simple – I put in an "X" in the cell if the two values are different (> or <), and a check mark in the cell if they are both ≤ and ≥ (i.e. equivalent of =).

Figure 6: Icon Set Dialog Box Configuration.

Figure 6: Icon Set Dialog Box Configuration.

Conclusion

I was able to make the icon set feature work for my simple application, but I could not imagine a more painful way for Microsoft to have designed this feature.

Save

Save

Save

Save

Save

Save

Save

Posted in Excel | 7 Comments

Battery Room Ventilation Math

Quote of the Day

We didn't lose the war for that, but I don't know why we didn't.

Admiral Leahy on Admiral Halsey's actions at the Battle of Leyte Gulf. As I have read more history of WW2, I have come to see that Admiral Halsey had issues – he was way too aggressive. I have also come to admire the thoughtful leadership of Spruance and Leahy.


Introduction

Figure 1: Photograph of a Battery Room Explosion in Sacremento.

Figure 1: Photograph of a 2001 Battery Room
Explosion in Sacramento. The ventilation in the
room had failed and the alarms were ignored.
Once the gas concentration had built up
sufficiently, all that was needed for an explosion
was an ignition source – telecom equipment
rooms are full of ignition sources. (Reference)

I recently had an engineer ask me how to determine the ventilation requirements for a battery room that contains lead-acid batteries being charged. As I have discussed in previous posts (here), lead-acid batteries often release hydrogen gas while being charged. Because hydrogen gas is explosive for concentration levels from 4% to 94% (reference), care must be taken to ensure that the hydrogen gas levels in a battery room do not rise to these concentration levels. Safe operation is usually maintained by ensuring that the battery room is properly ventilated. Of course, ventilation systems can fail, which means that battery rooms must have hydrogen sensors to generate alarms in the event of a ventilation failure. I have included references to some well-known hydrogen explosions in Appendix B.

In this post, I will be looking at how these ventilation calculations are performed. My focus here is on standard wet-cell batteries, which simply release any gases generated during charging. Other battery types, like Absorbed Glass Mat (AGM), will attempt to recombine the H2 and O2 released during charging. The AGM battery's internal gas recombination will reduce the amount of H2 released by these batteries – example shown here. I will compare the output of my model to those generated by a number of web-based and textbook sources. The results are in good agreement.

I have included my Mathcad (source and PDF) and Excel version here. The Excel version includes a number of scenarios that compare my worksheet results to the output from various web-based tools. There is a small macro in the worksheet that allows me to choose the scenario desired from a pick list.

Background

Definitions

Outgassing
In the case of a battery, outgassing is the undesired release of H2 and O2 gas during the charging process.
Float Voltage
Float voltage is the voltage at which a battery is maintained after being fully charged to maintain that capacity by compensating for self-discharge of the battery. (Source)
Charge Capacity
The charge capacity of a battery is defined as the total charge available from a battery under a constant current load over a specific time interval – usually 20 hours, but discharge intervals of 4, 6, 8, and 10 hours are also used. The choice of time interval is driven by the application. For example, telecom applications are usually required to have a backup time guarantee of 8 hours with a battery that has lost 20% of its charge capacity due to aging. This means the battery must have an initial charge rating specified for 10 hours (i.e. 10 hours · [100% - 20%]=8 hours).
The charge is measured in units of amp-hours (A-hr).
C-Rate
C-rate is the theoretical current that can be drawn in one hour from a battery of nominal capacity. For example, a 10 A-hr battery has a c-rate of 10 A. A battery's charge and discharge currents are often normalized with respect to c-rate. For example, we would refer to 1 A load from a 10 A-hr battery as a 0.1 c-rate load (=1 A/ 10 A).

Battery Outgassing Basics

Why Do Batteries Outgass?

Charging a battery means redepositing lead on the negative terminal and lead oxide on the positive terminal. Because no chemical process is perfectly efficient,  some of the charge current inevitably ends up electrolyzing the water in the electrolyte instead of charging the battery. The electrolysis process releases H2 and O2 molecules – an explosion hazard will exist if the H2 is allowed to accumulate. This electrolysis is inevitable because water electrolyzes at voltages greater than 1.227 V and the battery has a cell voltage greater than 1.75 V. The rate of outgassing increases dramatically with the cell voltage.

Many battery applications involve using batteries as a backup energy source. Ideally, these batteries are kept in a state of full charge until needed. However, all batteries have internal loss mechanisms that require a small charge current be continually applied to make up for these internal losses – we call this float charging. Feeding a constant charge current into a fully charged battery causes the battery to continuously generate H2 and O2. If you drive the battery with too much current at too high a temperature, it can also cause the battery to thermally runaway.

Key Points to Remember

The following list summarizes the key points associated with battery outgassing:

  • A battery will release H2 when it is being charged.
  • When being overcharged, each cell will release H2 at a rate proportional to the amount of excessive charge current. The rate of gas generation, RG, is given by Equation 1.
    Eq. 1 \displaystyle {{R}_{G}}=7.607\cdot \frac{{\text{mL}}}{{\text{min}}}\cdot {{I}_{{Overcharge}}}\cdot {{N}_{{CellsPerBattery}}}\cdot {{N}_{{Batteries}}}\cdot \left( {1+\frac{{T-{{T}_{{Ref}}}}}{{{{T}_{{Ref}}}}}} \right)

    where

    • NCellsPerBattery is the number of cells per battery.
    • NBattery is the number of batteries in the room.
    • IOvercharge is the amount of current going into gas generation.
    • TRef is the reference temperature (77 °F) for the nominal gas generation rate of 7.607 mL/min·amp. (derivation)
    • T is the battery temperature.
  • The charge current used under float conditions is usually specified as a percentage of the c-rate of the battery. I commonly see float charge currents from 1% to 5% of the c-rate. The choice of charge rate depends on the self-discharge rate of the lead-acid battery chosen. This rate can vary widely based on the chemistry of the battery (e.g. lead-calcium vs lead-antimony).

Ventilation Basics

Ventilation requirements are usually expressed in terms of the rate of air movement (e.g. cubic feet per minute or CFM) or the air exchange rate, which is the rate at which the entire volume of air in the room is replaced.

The required air flow rate, F,  is dependent only the rate of H2 generation and the required dilution level (Equation 2).

Eq. 2 \displaystyle F=\cdot \left( {\frac{{1-{{k}_{{H2Limit}}}}}{{{{k}_{{H2Limit}}}}}} \right){{R}_{G}}

where

  • kH2Limit is the maximum percentage of H2 gas allowed in the room.

The rate of air exchange is simple to compute given the volume of the battery room (VRoom) and the flow rate (F).

Eq. 3 \displaystyle {{R}_{{Exchange}}}=\frac{F}{{{{V}_{{Room}}}}}

Analysis

Setup

Figure 2 shows how I setup the calculations. It also includes some reference links that I used to test my routine. The gas generation rate function is the key utility function.

Figure M: Calculation Setup.

Figure 2: Calculation Setup.

Good Example of a Ventilation Calculation SBS Ventilation Calculator Good paper example Definition of Explosive Limit

Flow and Exchange Rate Functions

Figure 3 shows the important ventilation function: air flow rate (F) and rate of exchange  (RExchange). These functions are related by the volume of the room (VRoom).

Figure 3: Air Flow and Exchange Formulas.

Figure 3: Air Flow and Exchange Formulas.

Worked Example

I worked the following example using the SBS battery room ventilation site and obtained the same result as my Mathcad and Excel routines (Figure 4). I actually worked many more examples, which are included in the attached Mathcad and Excel material.

Figure 4: Worked Example Using SBS Calculator.

Figure 4: Worked Example Using SBS Calculator.

SBS Calculator Page Screenshot of Original Work

Conclusion

In this post, I provided Excel and Mathcad models for computing the ventilation requirements for a battery room. I included worked examples that showed that my routine provides the same results as some web-based tools – I even found an error in one online example.

I should mention that the Excel version provides a nice example of how to use Excel's scenario manager with data validation to provide a easy to use tool for engineers.

Appendix A: Rate of Gas Generation Per Ampere of Current

Figure 5 shows how to derive the hydrogen gas generation constant.

Figure M: Quick Derivation of Gas Generation Rate.

Figure 5: Quick Derivation of Gas Generation Rate.

Appendix B: Examples of Hydrogen Gas Explosions

  • USS Cochino, a US diesel-electric submarine that experienced a hydrogen gas explosion.
  • LZ129 Hindenburg, famous airship explosion.
  • USS Scorpion, a US nuclear submarine that some feel (e.g. Rear Admiral David Oliver) was lost due to a hydrogen explosion.

Save

Posted in Batteries | 1 Comment

Effective R Value of Common Wall Construction Methods

Quote of the Day

I've finally stopped getting dumber.

- Epitaph on the headstone in Budapest of Paul Erdös, one of the world's most prolific producers of mathematics.


Introduction

Figure 1: My Current Cabin. It is being torn down next Spring.

Figure 1: My Current Cabin. It is being torn
down next year. I will not miss it.

I have contracted with a firm to build an insulated, steel-sided, garage at my lake site in Northern Minnesota, which they will complete building sometime in December. Next summer, I have a contractor similar to those from APX Construction, starting construction of a new cabin about 50 meters from the garage. The new cabin will replace my old cabin (Figure 1), which is an old hunting shack that was built back in the 1930s.

I've been researching the best way to build as much of it as I can by myself but still need to Read More into the roofing as I need it to be as strong and wind-resistant as possible. Because the winters are hard in this part of the country, I have become interested in the insulation value of different types of wall construction. My contractor has his preferred approach (2x6 conventional framing), and I am curious as to how it compares with other framing methods. With this new cabin, I'm going to be storing a lot of stuff in there so I've also looked at ways of making it secure and factoring that in by checking out monitored alarms for the door and windows. I don't exactly want my new cabin to be smashed up so taking precautions is important.

In this post, I will put together a simple model for computing the R-value of different types of wall construction. This analysis will provide me a quantitative basis for understanding which methods are the most economically sound.

For those who are interested, I have included my Mathcad source and its PDF here.

Background

Definitions

Thermal Conductivity ([κ] = W/m-K)
Thermal conductivity is the property of a material to conduct heat. Heat transfer occurs at a lower rate through materials of low thermal conductivity than through materials of high thermal conductivity. The thermal conductivity of a material usually depends on its temperature – this means that thermal analysis is non-linear in general. It is analogous to electrical conductivity.
Thermal Resistivity ([Rλ]=m-K/W)
The reciprocal of thermal conductivity.
R-value aka Thermal Insulance ([R]=m2K/W or ft2 F hr/Btu)
It is the thermal resistance of a unit area of a material. This is the most common way for the insulation properties of building materials to be specified.
Thermal Resistance (Rθ=K/W)
Thermal resistance relates the change in temperature across a material to the heat flow through the material. We define thermal resistance as {{R}_{\theta }}\triangleq \frac{{\Delta T}}{Q}.
Thermal resistances combine just like electrical resistances. This means that you can model the thermal resistance of composite structure using series and parallel thermal resistances.
You can relate thermal resistance to R-value using the formula Q=\frac{{\Delta T}}{{{{R}_{\theta }}}}=\Delta T\cdot \frac{A}{R}, where Q is the heat flow through a specific piece of material, A is the area of the surface with an R-value of R,.
Thermal Bridging
Thermal bridging occurs when relatively conductive material allows an easy pathway for heat flow around a thermal barrier, like insulation. In electronics, we call the comparable phenomena leakage. The most common form of thermal bridging occurs when wall studs and headers allow heat to flow around insulated wall cavities. I really did not understand the importance of thermal bridging until I used an infrared camera to photograph one of my walls. You could clearly see the framing members (Figure 2). The dark areas indicate lower temperature, which means leakage of heat.

Figure M: Thermal Photograph of a Stud-Framed Wall in My Condo.

Figure 2: Thermal Photograph of a Stud-Framed Wall and Ceiling in My Montana Condo.

Framing Factor
The percentage of the outer surface of a home with a thermal bridge of framing material between the indoor and the outdoor.

Wall Construction Methods

Building Sciences Corporation has an excellent discussion on the differences between conventional framing and advanced framing, and I strongly encourage you to visit their site.

There are two main types of residential framing today:

  • Conventional framing
    Also called platform framing, it started in the 1930s as a way to reduce the fire risk associated with balloon framing.
  • Advanced framing
    This approach to framing has been coming on strong since 2000. It uses various techniques to reduce both thermal bridging and the amount of wood used.

Conventional Framing

Virtually all homes today are built using conventional framing, which has been the standard since the 1930s and is nicely illustrated in by Figure 3. For the studs that surround the heated rooms, insulation usually fills the gaps between the studs. Conventional framing has the advantages of being simple and using inexpensive materials, but it has the disadvantage of having many paths for heat to flow around insulation through thermal bridging. This makes it expensive to heat or cool.

Figure M: Example of Traditional Framing.

Figure 3: Example of Traditional Framing. (Source)

Advanced Framing

Advanced framing methods have two purposes: (a) more efficient use of materials, and (b) more thermally efficient, which it accomplishes by reducing the amount of framing material that will act as a thermal bridge. Figure 4 provides a good example of some of the techniques used with advanced framing.

Figure M: Example of Advanced Framing Techniques. (Source)

Figure 4: Example of Advanced Framing Techniques. (Source)

Computing Wall Component R Values

Figure 5 shows my wall construction model. The variables are all associated with wall construction, i.e. on-center stud separation or pitch, and the wall thickness (τ).

Figure 3: Wall Construction Model.

Figure 5: Wall Construction Model.

Figure 6 shows how I defined my R value units and the R values I used for specific components (Source).

Figure 3: R Values Used in this Post.

Figure 6: R Values Used in this Post.

Analysis

Figure 7 shows my calculations for the R value of a home as a function of (1) the stud pitch, (2) conventional vs advanced framing, and (3) 2x4 versus 2x6 studs. Both the stud pitch and framing type are handled by way of a parameter called the framing factor (FF). My FF values came from this document. The stud width is represented by the variable τ.

Figure 5: Table of R Values.

Figure 7: Table of R Values.

Conclusion

Here is a larger version of the table to make it easier to read.

Figure M: Table of R Values By Construction Method.

Figure 8: Table of R Values By Construction Method.

There are several conclusions that I can draw from my table:

  • Switching from a 16" stud pitch to a 24" stud pitch makes little thermal difference (~0.7R) , but it will reduce the amount of framing material I need.
  • Switching from conventional framing to advanced framing makes little thermal difference (<1R).
  • Using 2x6 studs instead of 2x4 studs makes a big difference (~5R).
  • Moving from conventionally framed 2x4s with a 16" pitch to advanced framed 2x6s with a 24" pitch gives me 6.7R of additional insulation value – this is a big deal.

There are additional things I can do to improve the R value of my construction practices, like adding a layer of insulation. These changes can easily be added to my model.

Save

Posted in Construction | 1 Comment

Effect of Wire Length on Surge Protector Let-Through Voltage

Quote of the Day

You know how an economist gets out of a 20-foot deep hole? He assumes the existence of a 20-foot long ladder.

— Unnamed politician giving his opinion on economists


Introduction

Figure 1: Common Surge Protector. (Source)

Figure 1: Common Surge Protector. Notice the
10 AWG (6 mm2) hookup wires. (Source)

I have been looking at different options for providing surge protection on some AC circuits. During my investigations, I started read about the surge protector shown in Figure 1, which is a commonly deployed unit that is well-thought of and has an excellent history in the field.

While reading about how these units worked, I noticed that the amount of surge voltage they let pass (called let-through voltage) is a function of the hookup wire length. The units are tested with a hookup length of 6 inches, and the user is warned that the let-through voltage increased by ~20 V per inch of additional wire. I became curious about the origin of this rule of thumb. In this post, I will show you how to calculate the rule of thumb for yourself.

While most of my surge stories are related to lightning strikes, I do have one story that shows that surges can occur for other reasons. One of our customers had one of our products on the same AC circuit as a very large copy machine – the largest I have every seen. This copy machine continuously generated enormous power surges  that actually wore our surge protectors out. I resolved the issue by convincing the customer to put the copy machine on a different circuit, and the problem vanished.

Background

Definitions

Let Through Voltage (VLT)
Voltage let-through refers to the amount of transient voltage passed through a power conditioning device to the load. A transient is a high amplitude, short duration spike or surge superimposed on the normal waveform. (Source)
Self-Inductance (LWire)
Self inductance is defined as the induction of a voltage in a current-carrying wire when the current in the wire itself is changing. In the case of self-inductance, the magnetic field created by a changing current in the circuit itself induces a voltage in the same circuit. Therefore, the voltage is self-induced. (Source)
Metal Oxide Varistor (MOV)
A varistor is an electronic component with an electrical resistance that varies with the applied voltage. A metal oxide varistor is a type of varistor that contains a ceramic mass of zinc oxide grains, in a matrix of other metal oxides (such as small amounts of bismuth, cobalt, manganese) sandwiched between two metal plates (the electrodes). The boundary between each grain and its neighbors forms a diode junction, which allows current to flow in only one direction. The mass of randomly oriented grains is electrically equivalent to a network of back-to-back diode pairs, each pair in parallel with many other pairs. When a small or moderate voltage is applied across the electrodes, only a tiny current flows, caused by reverse leakage through the diode junctions. When a large voltage is applied, the diode junction breaks down due to a combination of thermionic emission and electron tunneling, and a large current flows. The result of this behavior is a highly nonlinear current-voltage characteristic, in which the MOV has a high resistance at low voltages and a low resistance at high voltages. (Source)

Lightning Surge Model

Figure 2 shows how a surge protector is rated. For the example I will work here, we will be using a 3000 A spice with an 8 μs rise time and 20 μs fall time.

Figure M: Text Description of Surge Test Waveform.

Figure 2: Text Description of Surge Test Waveform.  (Source)

Figure 3 shows what a typical surge spike looks when not driving the low-resistance of the MOV-based surge protector. The presence of a surge protector will put a large load on this waveform and dramatically reduce the peak level down to the let-through voltage. However, the current will surge up to 3000 A.

Figure M: Surge Voltage Test Waveform.

Figure 3: Surge Voltage Test Waveform. (Source)

Figure 4 shows impact of the surge voltage looks like with different lead lengths. The amplitude reduction is dramatic.

Figure 3: Surge Voltage vs Lead Length.

Figure 4: Surge Voltage vs Lead Length. (Source)

Video Briefing

Figure 5 shows a good demonstration of how a surge protector is built and how it works.

Figure 5: Good video briefing on Eaton Surge Protectors.

Installation Model

Figure 6 shows how the effect of lead wire inductance is modeled.

Figure 4: Surge Protector Installation Diagram.

Figure 6: Surge Protector Installation Diagram. (Source I modified to include variable names)

Analysis

Inductance Modeling

Figure 7 shows a commonly used formula for the self-inductance of a cylindrical wire.

Figure M: Clip from Rosa Reference.

Figure 7: Clip from Rosa Reference. This formula gives the inductance of a straight wire segment in nH when all dimensions are in cm. (Source)

I usually see the formula of Figure 7 expressed in terms of the ratio of dimensions, which I derive in Figure 8.

Figure 6: Derivation of a Common Alternative Form of Rosa's Formula.

Figure 8: Derivation of a Common Alternative Form of Rosa's Formula.

Wire Dimension Modeling

Figure 9 shows how I used a formula from the Wikipedia to convert wire gauge values into metric diameters. I also put some check figures in my worksheet to show the accuracy of this formula, which is within 0.032% of true over the range of values for which I am interested.

Figure M: Simple Equation to Compute Diameter from American Wire Gauge Value.

Figure 9: Simple Equation to Compute Diameter from American Wire Gauge Value.

Let-Through Voltage Due to Lead Length Calculations

Figure 10 shows how to compute the surge voltage across the two lead wires. I am ignoring any contribution from ohmic losses – only inductive effects are modeled.

Figure 10: Calculation of Surge Voltage Across Both Leads.

Figure 10: Calculation of Surge Voltage Across Both Leads.

Conclusion

I was able to show why the surge protector vendors often warn engineers that every inch of lead wire will increase the let-through voltage by 20 V per inch. This agrees with my constant admonishment to junior engineers about "keeping your leads short".

Save

Save

Save

Save

Save

Save

Save

Save

Save

Save

Save

Save

Save

Save

Save

Save

Posted in Electronics | Comments Off on Effect of Wire Length on Surge Protector Let-Through Voltage

Video of Wild Cat in Northern Minnesota

Quote of the Day

Hope without a plan is denial.

— Time management expert


Like me, a number of my coworkers have cabins in Northern Minnesota and most of us have cameras that record activity on our properties. A coworker came in the other day with this video that shows a wild cat going by one of his cameras. I am not sure what kind of cat it is – probably a lynx. This site is not far from the Canadian border. Maybe one of you out there can identify it?

Posted in Cabin, Personal | Comments Off on Video of Wild Cat in Northern Minnesota