Solar Eclipse Math

Quote of the Day

You measure the size of the accomplishment by the obstacles you had to overcome to reach your goals.

— Booker T. Washington


For more on the up-coming eclipse, see this post.

Introduction

A couple of weeks ago, I was watching the Wonders of the Solar System with Brian Cox on the Science channel.In this episode, he was talking about the Moon and solar eclipses. He made a comment that the region of totality (i.e. complete darkness) during a solar eclipse is only a few hundred kilometers across. To illustrate this point, I found a great picture (Figure 1) taken from the Mir space station of the moon's shadow on the Earth.

Moon's Shadow Moving Across the Earth (Source: Mir, 1999)

Figure 1: Moon's Shadow Moving Across the Earth (Source: Mir, 1999)

I have never been through a total eclipse, but I must admit that I have always found them interesting. Maybe I can talk my lovely bride into taking a solar eclipse cruise? She still has not responded to my request for a vacation touring World War II Pacific battefields. Aren't I romantic? Anyway, I started to wonder whether I could verify the statement that Brian Cox made during the program.

I began my little exercise by looking for an exact number for the size of the region of totality and some details on the geometry of the situation. It did not take long. In the book, Historical Eclipses and Earth's Rotation by Stephenson, I found the following statement.

Under a vertical sun the umbra can never exceed about 270 km in diameter. However, at lower solar altitudes the elongated shadow of the Moon may be much wider than this, occasionally exceeding 500 km.

This quote is completely consistent with Brian Cox's statement and gives me a bit of information on the geometry of the situation. Let's see if a little geometry can verify this statement.

First, A Few Definitions

Let's work with the definitions from dictionary.com.

Totality
The quality or state of being total; as, the totality of an eclipse.For a solar eclipse, totality is the state of the sun being completely obscured to an observer by the moon. Totality depends on the position of the observer.
Umbra
A region of complete shadow resulting from the total obstruction of light by an opaque object, especially the shadow cast by the moon onto the earth during a solar eclipse.

Analysis

Umbra Geometry

Figure 2 illustrates the basic solar eclipse geometry.

Figure 2: Solar Eclipse Geometry

Figure 2: Solar Eclipse Geometry


The situation in Figure 2 produces the smallest region of totality on the earth. A little high-school trigonometry gives me the following equation.

\sin \left( \alpha \right) = \frac{{{r_{Sun}} - {r_{Moon}}}}{{{d_{Sun}} - {d_{Moon}}}} \Rightarrow \alpha = \arcsin \left( {\frac{{{r_{Sun}} - {r_{Moon}}}}{{{d_{Sun}} - {d_{Moon}}}}} \right)

Next, I will use this angle to compute the length of the umbra (dUmbra).

{d_{Umbra}} = \frac{{{r_{Moon}}}}{{\sin \left( \alpha \right)}}

Umbra Spot Size on the Earth

Figure 3 illustrates how I estimated the umbra spot size on the Earth. I am ignoring the curvature of the Earth because the spot is so small and the Earth is so big.

Figure 3: Illustration of Umbra on the Earth

Figure 3: Illustration of Umbra on the Earth

Again, a little bit of trigonometry gives me the following equation.

{s_{Umbra}} = 2 \cdot \left( {d_{Umbra} - \left( {{d_{Moon}} - {r_{Earth}}} \right)} \right) \cdot \tan \left(\alpha\right)

s_{Umbra} is roughly the diameter of the umbra spot on the Earth. This completes my derivation.

Solar Eclipse Data

Solar Eclipse Data
Symbol Description Value Units
rSun Radius of the Sun 696,000 km
rMoon Radius of the Moon 1738 km
dSmax Maximum distance from the Sun to the Earth 152,100,000 km
dMmax Maximum distance from the Moon to the Earth 356,400 km
rEarth Radius of the Earth 6378 km

Results

Simply substitute the eclipse data into the equations and you get 273 km for the maximum diameter region of totality when the sun is vertical with respect to the observer. As far as I am concerned, this analysis confirms both Cox's and Stephenson's statements. This was a nice little problem.

Here is a screen capture of my calculations.

Here is a copy of these calculations in Excel.

Posted in Astronomy | Tagged , , | 32 Comments

Dispersion Power Penalty Modeling (Part 3)

Deriving Equation 2

Equation 2 is derived from Equation 7 by noting the following items.

  • A true normal pulse has infinite length, so we cannot have a high speed data system that sends true normal pulses.
  • A common choice is to select a bit time that will contain 95% of the bit energy at the point of transmission.
  • If you set the bit time equal to ±2\sigma_0 about the signal peak (4 \cdot \sigma_0 total), the bit time will contain 95% of the normal pulse's energy.
  • This choice is much more conservative than the choice in Equation 1, which can be shown to only have 31% of the pulse energy contained in the bit time.

Given these assumptions, we can state Equation 10 directly.

Eq. 10      \sigma_0 = \frac{T}{4} = \frac{1}{4 \cdot B}

We can substitute Equation 10 into Equation 7 to obtain Equation 2.

         P{P_D} = 10 \cdot \log \left( {\sqrt {1 + {{\left( {\frac{{D \cdot L \cdot {\sigma _\lambda }}}{{\frac{1}{{4 \cdot B}}}}} \right)}^2}} } \right)

         P{P_D} = 5 \cdot \log \left( {1 + {{\left( {4 \cdot B \cdot D \cdot L \cdot {\sigma _\lambda }} \right)}^2} } \right)

Deriving Equation 3

Equation 3 is derived from Equation 7 by noting the following items.

  • Select a bit time that will contain 95% of the signal energy within the bit time at the point of reception.
  • If you set the bit time equal to \pm 2 \cdot \sigma_0 about the signal peak (4 \cdot \sigma_0 total), the bit time will contain 95% of the normal pulse's energy.

This derivation is a bit more complicated than the previous derivations because we need to calculate \sigma_0 given that the signal \sigma at distance L has been stretched by the factor k, which is computed using the following equation.

         k = \sqrt {1 + {{\left( {\frac{{D \cdot L \cdot {\sigma _\lambda }}}{{{\sigma _0}}}} \right)}^2}}

Given the factor k, we can compute \sigma_0 as follows.

         \sigma\left(\text{Distance = L}\right)  = \frac{1}{{4 \cdot B}} \Rightarrow {\sigma _0} = \frac{1}{{4 \cdot B \cdot k}}

Substituting this equation into Equation 7 gives us the following.

         {k^2} = 1 + {\left( {\frac{{D \cdot L \cdot {\sigma _\lambda }}}{{\frac{1}{{4 \cdot B \cdot k}}}}} \right)^2} = 1 + {\left( {4 \cdot B \cdot D \cdot L \cdot {\sigma _\lambda } \cdot k} \right)^2}

This equation can be solved for the k to yield

         k = \sqrt {\frac{1}{{1 - {{\left( {4 \cdot B \cdot D \cdot L \cdot {\sigma _\lambda }} \right)}^2}}}}

This equation does not only represent the elongation of the pulse – it also represents the reduction in amplitude of the pulse. Therefore, we simply convert this equation to dB to get Equation 3.
             P{P_D} = 10 \cdot \log \left( {\sqrt {\frac{1}{{1 - {{\left( {4 \cdot B \cdot D \cdot L \cdot {\sigma _\lambda }} \right)}^2}}}} } \right) = - 5 \cdot \log \left( {1 - {{\left( {4 \cdot B \cdot D \cdot L \cdot {\sigma _\lambda }} \right)}^2}} \right)

This equation is very commonly used. It is different from the Equations 1 and 2 in that it contains a singularity. This singularity occurs because there are distances beyond which the dispersion is so severe that 95% of the bit energy cannot be contained in a bit time at the receiver. This characteristic has confused many people because they are not used to thinking about ISI at the receiver.

Deriving Equation 4

Equation 4 is Equation 3 after applying a Taylor series approximation for the reciprocal of the square root. The approximation is shown below and is only valid for small x.

         \frac{1}{{\sqrt {1 - {x^2}} }} \approx 1 + \frac{1}{2} \cdot {x^2}

This approximation can used to simplify the PP_D a bit.

        PP_D = 10 \cdot \log \left( {\frac{1}{\sqrt {1 - {\left( 4 \cdot B\cdot D \cdot L \cdot \sigma_\lambda \right)}^2}} }\right) \approx 10 \cdot \log \left( {1 + \frac{1}{2} \cdot {{\left( {4 \cdot B \cdot D \cdot L \cdot {\sigma _\lambda }} \right)}^2}} \right)

This gives us Equation 4. It is important to remember that this equation is only valid when the dispersion power penalty is small. I do not view this as a serious restriction because I would not deploy a system with a large dispersion power penalty.

Conclusion

I know this was long, but it will be useful. Here is what was accomplished:

  • The commonly used dispersion power penalty formulas were put in one place.
  • Their underlying assumptions were examined in detail.
  • It was demonstrated that they all come from the same basic equation.

My next blog posts will be shorter and less specialized.

Posted in Fiber Optics | Tagged , , | 2 Comments

Dispersion Power Penalty Modeling (Part 2)

Modeling Pulse Distortion

Choice of Pulse Basis Function

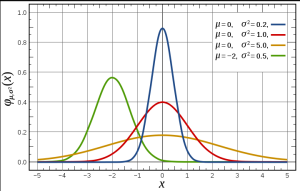
As with most modeling problems, it is very important to choose a function that accurately represents your physical signal. The most commonly used pulse models in optics are based on the normal curve. The normal curvea is described by the following equation.

N(t,\mu,\sigma) = \frac{1}{{\sqrt {2 \cdot \pi \cdot } {\sigma }}}\exp \left( {-\frac{\left(t-\mu\right)^2}{{2 \cdot {\sigma}^2}}} \right)

where \sigma is the standard deviation and \mu is the mean of the normal curve. The Wikipedia has a nice graph of the normal curve, which I include in Figure 2.

Graph of Normal Curve (Source:Wikipedia)

Graph of Normal Curve (Source:Wikipedia)

In this particular work, the pulse has its time (function f) and wavelength(function h) functions each modeled by different normal curves.

h(\lambda,\lambda_c, \sigma_\lambda) = \frac{1}{{\sqrt {2 \cdot \pi \cdot } {\sigma _\lambda}}}\exp \left( -{\frac{{{\left(\lambda-\lambda_c\right)^2}}}{{2 \cdot {\sigma _\lambda}^2}}} \right)

Eq 4.   f(t,T,\sigma_T) = \frac{1}{{\sqrt {2 \cdot \pi \cdot } {\sigma _T}}}\exp \left( -{\frac{{{\left(t-T\right)^2}}}{{2 \cdot {\sigma _T}^2}}} \right)

where t is time, T is the fiber travel time for the center of the pulse, \lambda is the wavelength, \lambda_c is the center wavelength of the pulse, \sigma_T is the standard deviation of the pulse width in time, and \sigma _\lambda is the standard deviation of the pulse width in wavelength. For this discussion, we are going to ignore attenuation losses and focus on the effect of dispersion. It turns out that the losses due to attenuation are easy to add, but they add more bulk to this discussion that is already too long.

Modeling Pulse Dispersion Impact on Power

There are many textbooks that provide rigorous derivations of the equation we will be using to model pulse spreading. I will use a more intuitive argument here to motivate, but not prove, the use of this equation. We begin our discussion with a few observations.

  • The pulse time function can be modeled as being composed of two normal signals: (1) the initial pulse shape, and (2) the standard deviation of the dispersed laser pulse.
  • The variance of the sum of these two signals is the sum the variances.
  • The standard deviation of the dispersed laser wavelengths is given by D \cdot L\cdot \sigma_\lambda.

These observations lead us to write down the following equation directly (a detailed proof involves convolutions).

Eq.5   \sigma_T^2 = \sigma_0^2 +\left(D \cdot L \cdot \sigma_\lambda\right)^2

where \sigma_T^2 is the time-domain variance of the total waveform, \sigma_0^2 is time-domain variance of the initial pulse (t=0), L is the distance of pulse travel, and \sigma_\lambda^2 is the standard deviation of the laser pulse.

Increasing \sigma_T will increase the pulse duration and reduce its amplitude, exactly what happens in a dispersed pulse. Substituting Eq. 5 into Eq. 4 gives us the equation of the dispersed pulse.

f(t,T) = \frac{1}{{\sqrt {2 \cdot \pi } \cdot \sqrt {\sigma _0^2 + {{\left( {D \cdot L \cdot {\sigma _\lambda }} \right)}^2}} }} \cdot \exp \left( -{\frac{{{{\left( {t - T} \right)}^2}}}{{2 \cdot \left( {\sigma _0^2 + {{\left( {D \cdot L \cdot {\sigma _\lambda }} \right)}^2}} \right)}}} \right)

Eq. 6   f(t,T) = \frac{1}{{\sqrt {1 + {{\left( {\frac{{D \cdot L \cdot {\sigma _\lambda }}}{{\sigma _0}}} \right)}^2}} }} \cdot \frac{1}{{\sqrt {2 \cdot \pi } \cdot {\sigma _0}}} \cdot \exp \left( -{\frac{{{{\left( {t - T} \right)}^2}}}{{2 \cdot \left( {\sigma _0^2 + {{\left( {D \cdot L \cdot {\sigma _\lambda }} \right)}^2}} \right)}}} \right)

A quick look at Equation 6 shows that its amplitude reduces with range by a factor of \sqrt{1 + \left(\frac{D \cdot L \cdot \sigma_\lambda}{\sigma_0}\right)^2}. This reduction in pulse amplitude means a reduction in power that can be modeled using Equation 7.
Eq. 7   P{P_D} = 10 \cdot \log \left( {\sqrt {1 + {{\left( {\frac{{D \cdot L \cdot {\sigma _\lambda }}}{{\sigma _0}}} \right)}^2}} } \right)
All the commonly used dispersion power penalty formulas appear to be based on this equation. Given this equation, I now can demonstrate how Equations 1 through 4 (listed in part 1 of this blog series) were derived.

Equation Derivations

The only differences I can find between the equations are related to how one defines the relationship between the bit rate and \sigma_0. This relationship is set by the amount of ISI that the engineer can tolerate. Here is a quick summary of the assumptions behind each equation:

  • Equation 1 assumes that the engineer wishes to define the bit time as equal to that of a rectangular pulse with the same energy and peak value as a normal pulse.
  • Equation 2 assumes that the engineer wishes to define the bit time as the period required to contain 95% of the pulse energy at the time of transmission.
  • Equation 3 assumes that the engineer wishes to define the bit time as the period required to contain 95% of the pulse energy at the time of reception.
  • Equation 4 is Equation 3 with a Taylor series approximation applied.

With all this said, it is now time to dive into the details.

Deriving Equation 1

Equation 1 is derived from Equation 7 using the following assumptions.

  • The pulse is specified to be of time duration T and amplitude P, which implies rectangular in shape.
  • The Gaussian pulse equivalent has the same total energy and peak amplitude.

Given these assumptions and the fact that the area under a Gaussian pulse is P \cdot \sqrt {2 \cdot \pi } \cdot \sigma_0, we can derive the \sigma_0 of the Gaussian pulse as follows.

Eq. 8   P \cdot T = \sqrt {2 \cdot \pi } \cdot \sigma_0 \cdot P

Given that the bit period T is related to bit rate B by B = \frac{1}{T}, we can solve Eq. 8 for \sigma_0 to obtain Eq. 9.

Eq. 9   \sigma_0 = \frac{T}{{\sqrt {2 \cdot \pi } }} = \frac{1}{{\sqrt {2 \cdot \pi } \cdot B}}

We can substitute Equation 9 into Equation 7 to obtain Equation 1.

P{P_D} = 10 \cdot \log \left( {\sqrt {1 + {{\left( {\frac{{D \cdot L \cdot {\sigma _\lambda }}}{{\frac{1}{{\sqrt {2 \cdot \pi } \cdot B}}}}} \right)}^2}} } \right)

P{P_D} = 5 \cdot \log \left( {1 + 2 \cdot \pi \cdot {{\left( {B \cdot D \cdot L \cdot {\sigma _\lambda }} \right)}^2} } \right)

The next blog will cover deriving Equations 2 – 4.

Posted in Fiber Optics | Tagged , , | 4 Comments

Dispersion Power Penalty Modeling (Part 1)

An Apology

This blog post is rather long (3 parts). I have had so many questions on this topic lately that I thought I should put some of the notes into a more formal format. The discussion is very specific to fiber optic networks and requires some knowledge of fiber to follow.

Introduction

I often work with people who are new to fiber optics and they often find dispersion confusing. Dispersion is caused by the variation of the speed of light in glass with wavelength, and the distortion it causes can limit the range of some deployments more than attenuation. People are very used to the idea that the speed of light is constant in a vacuum, but they are unaccustomed to the idea that the speed of light varies on a fiber as a function of wavelength, polarization, and fiber construction. In our system, dispersion is caused mainly by the variation in light speed as a function of wavelength, which is called chromatic dispersion.

Chromatic dispersion causes the pulses of light ("bits") on the fiber to stretch out in time and reduce in amplitude. The stretching out is called Inter-Symbol Interference (ISI). The reduction in the amplitude of the pulses is called the dispersion Power Penalty (PP_{D}). Figure 1 illustrates how the pulse distorts as it moves down the fiber.

Illustration of Pulse Distortion Down the FIber

Figure 1: Illustration of Pulse Distortion Down the Fiber

While doing some system modeling, I noticed that there were different equations being used to compute PP_{D}. Here are some examples of these equations.

(Eq. 1) {PP _D} = 5 \cdot \log \left( {1 + 2 \cdot \pi  \cdot {{\left( {B \cdot D \cdot L \cdot {\sigma _\lambda }} \right)}^2}} \right) (see Ref 1, 4)
(Eq. 2) {PP _D} = 5 \cdot \log \left( {1 +  {{\left( {4 \cdot B \cdot D \cdot L \cdot {\sigma _\lambda }} \right)}^2}} \right)

(see Ref 5)
(Eq. 3) {PP _D} =  -5 \cdot \log \left( {1 - {{\left( {4 \cdot B \cdot D \cdot L \cdot {\sigma _\lambda }} \right)}^2}} \right)

(see Ref 2, 3)
(Eq. 4) {PP _D} = 10 \cdot \log \left( {1 + \frac{1}{2} \cdot {{\left( {4 \cdot B \cdot D \cdot L \cdot {\sigma _\lambda }} \right)}^2}} \right) (Ref lost)

where

  • B is the bit rate
  • L is fiber distance
  • D is the dispersion constant of the fiber
  • \sigma_\lambda is the spectral standard deviation of the laser

I started to look at the equations in detail because I wanted to know why different equations were used to model the same thing. It turns out the equations are very similar and simply reflect different ways of defining or measuring some of the parameters critical to dispersion. The derivation of Equation 4 also uses a mathematical approximation. I thought it would be useful to document where the equations come from and why they look different. This example also illustrates a nice application of the normal curve that does not involve statistics.

Background

Speed of Light and Index of Refraction

The key to understanding chromatic dispersion is to understand that the index of refraction in glass varies with wavelength. The relationship between the speed of light in glass and the index of refraction is given by the following equation.

             c_{glass} =\frac{c}{n\left(\lambda\right)}

where

  • c is the speed of light in a vacuum
  • c_{glass} is the speed of light in glass
  • n\left(\lambda\right) is the index of refraction
  • \lambda is the wavelength of light.

Figure 2 illustrates how the index of refraction varies by wavelength and type of glass.

Refractive Index as a Function of Wavelength and Glass Type

Figure 2: Refractive Index as a Function of Wavelength and Glass Type

Sources of Chromatic Dispersion

Fiber-Related

When we talk about chromatic dispersion, we are talking about a characteristic that is composed of three parts.

  • Material Dispersion
    This contribution is caused by the variation of the index of refraction in glass with wavelength. A prism uses this form of dispersion to separate out the colors of light. Material dispersion has nothing to do with the fiber – it is a property of the glass. Figure 1 illustrates how the index of refraction in various forms of glass varies with wavelength.
  • Waveguide Dispersion
    The fiber is a form of waveguide and the optical power divides between the core and cladding. The cladding and core indexes of refraction are different, which causes dispersion.
  • Profile Dispersion
    The glass within the core and cladding each have indexes of refraction that varies with wavelength and their construction. This also introduces dispersion.

Mathematically, chromatic dispersion is usually modeled by a single parameter that consists of three terms.

             D = {D_M} + {D_W} + {D_P}

where

  • D is the total chromatic dispersion constant
  • DM is the material dispersion constant
  • DW is the waveguide dispersion constant
  • DP is the profile dispersion constant

The following discussion assumes that all the sources of chromatic dispersion can be modeled using the single parameter D.

Optical Source-Related

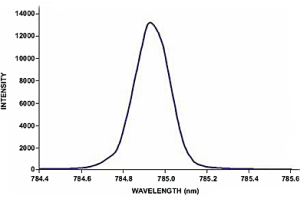
If the fiber was driven by a single wavelength, no chromatic dispersion would occur. However, no source of light produces a single wavelength – they all generate a range of wavelengths. In fact, simply generating a pulse causes some spectral spreading. Sometimes the dispersion is significant – sometimes it is not. The purest sources of light comes from lasers, and our systems are driven by lasers. There are two main types of lasers used in telecommunications: Fabry-Perot (FP) and Distributed Feedback (DFB). The FP lasers generate multiple discrete wavelengths (called modes) and are subject to a rather nasty form of dispersion called mode-partition noise. This imposes a severe limitation on the range of FP-based systems. I will not be discussing mode-partition noise here. Our systems use DFB lasers, which generate light in very limited band with a distribution that is modeled well by a normal curve. The graphs in Table 1 illustrate the spectral characteristics of these lasers.

Table 1: Examples of Laser Spectral Characteristics
FP Laser DFB Laser
Spectral Characteristic of FP Laser Spectral Characteristic of DFB Laser
Source Source

Part 2 of this blog will address the analysis and modeling of dispersion losses.

References

1. Agrawal, Govind. P.J. Anthony, and T.M Shen. "Disperson Penalty for 1.3-µm Lightwave Systems with Multimode Semiconductor Lasers." Journal of Lightwave Technology. May 1988: pp 620-625. Print.
2. Agrawal, Govind. Fiber-Optic Communication Systems. 3rd ed. NY: Wiley, 2002. p 204. Print.
3. Keiser, Gerd . Optical communications Essentials. 1st. Boston, MA: McGraw-Hill Professional, 2003. p. 265. Print.
4. Miller, John, and Ed Friedman. Optical Communications Rules of Thumb. Boston, MA: McGraw-Hill Professional, 2003. p. 325. Print.
5. Agrawal, Govind. Lightwave technology: Telecommunication systems, Volume 2. New York: Wiley, 2005. p. 170. Print.

Posted in Fiber Optics | Tagged , , | 9 Comments

Engineer Humor (yes, they do have a sense of humor)

Introduction

Engineers can be hilarious – albeit a bit dry and cynical. Engineers are problem-solvers by nature. Much of their humor involves problem solving. Here are a few things that came up this morning that I thought would be worthwhile sharing here.

Troubleshooting Phases

I had a hardware engineer in my group who had a 12-step problem solving process that he used EVERY SINGLE TIME. He wrote code for Field Programmable Gate Arrays (FPGAs), so his problem resolutions always involved changing some FPGA source code. Here is his troubleshooting process.

12-Step Troubleshooting Process
Step Number Name
Step 1 That Can't Happen, It Must Be a Test Problem.
Step 2 Blame Software
Step 3 Doubt - Could I Have Made an Error?
Step 4 Blame Software
Step 5 How Did This Ever Work?
Step 6 Despair
Step 7 Hope
Step 8 Deep Despair
Step 9 Blame Software
Step 10 The Return of Hope
Step 11 Intense Effort
Step 12 It Was a One-Line of Source Code Change

Quality

We had a discussion this morning on software quality. It became obvious that there were levels of software quality. Here is what I gleaned from that conversation.

Levels of Software Quality
Level Description Comment
Level 1 Crap-Like The software has some good points, but there are some serious issues.
Level 2 Crapola The software appears to have some good points, but deep-down it really sucks.
Level 3 Polished Crap This is software that really does suck, but people have worked really hard to make it seem like it doesn't.
Level 4 Crap The software is so bad that it really does stink.
Level 5 Total Crap How does code like this get written?

Problem Solving Progress

I had a manager under me that used the following scale to describe how close we were to solving a problem. His approach also came up in a meeting this morning.

Nearness of a Solution
Level 1 Description
Level 1 We have no idea where the problem is; it could be anywhere.
Level 2 We have the bug isolated to a hemisphere (Eastern or Western).
Level 3 We know the bug is somewhere in this area.
Level 4 We have the bug cornered.
Level 5 We have the bug in our cross-hairs.
Level 6 The bug is begging for mercy.

Yes, this was a typical morning.

Posted in Management | Tagged , | Comments Off on Engineer Humor (yes, they do have a sense of humor)

My Little Gilligan's Island - Part 1 (The Shower)

Introduction

My cabin in northern Minnesota is very primitive (the only water is lake water, no heat, no air conditioning, no phone, no Internet) and I do not want to put any money into it until I get my sons through college. I do have electrical power, and I'm considering getting a generator installed by an electrician from a company like SALT (https://saltle.com/electrician-texas-service-areas/hutto-electrical-services/), should the weather ever take a turn and leave me without power. To make the cabin more livable, I have developed a few ways to make things a bit more comfortable for little extra money. One thing I have put in is a primitive lake water shower. This blog post goes into how the shower was put together and how we use it. There was a bit of design in resolving this issue and this post describes my solution.

Design Approach

When my wife and I first bought the cabin, we tried to stay clean by bathing in the lake. Unfortunately, the lake temperature never gets above the mid-70 °F range during the summer, and during spring and fall it drops below 50°F (it freezes over in winter). This makes for very uncomfortable bathing. To make bathing comfortable, my basic approach will be to bring the water up from the lake to a storage area, heat it, and then use it for showering. This approach required me to solve the following problems.

  • Transporting the lake water
  • Storing the lake water
  • Heating the water
  • Designing a shower (pump, plumbing, nozzle, shower enclosure)
  • Removing the gray water

Let's take these items one by one.

Transporting the Lake Water Up the Hill

The most convenient place for the shower is about 100 feet from the lake and up a 15 foot hill. Let's think about the amount of water I will be needing for a showering.

  • It is not unusual for me to have 8 people at the cabin.
  • A typical shower head puts out 3 gallons per minute.
  • A typical shower takes about 2 minutes.

The total amount of water required for the showers is given by the following equation.

V = N \cdot t \cdot F = 8{\text{ showers}} \cdot 2\frac{{\min }}{{{\text{shower}}}} \cdot 3\frac{{{\text{gal}}}}{{{\text{min}}}} = 48{\text{ gal}}

where V is the total volume of water (gallons), N is the number of people showering (8), F is the flow rate (3 gallons per minute), and t is the length of an average shower (2 minutes). This means that I need 48 gallons of water for showering. Since water weighs ~8 pounds per gallon, I need nearly 400 pounds of water. Using pails to move the water up the hill is not an option. I need a pump. It turns out that I actually designed a pump system that works well. I will discuss the pump system in a later blog post. Assume for now that I am using an electrical pump to bring the nearly 400 pounds of water up from the lake to a storage area. My pump average 15 gallons per minute, which is about 120 pounds of water per minute. This means that I can move all the water I need in less than 4 minutes with no lifting.

Storing the Lake Water

The cheapest way to store 48 gallons of water is to buy a plastic drum. While this was easy and cheap, it complicated the problem of heating the water. The drums are made of a plastic that does not like to get hotter than 180 °F. This will complicate the design of my heating system, but not too much.

Heating the Lake Water

I had heard another engineer mention that he had heated molasses in a 55 gallon drum using a drum heater belt (example). This sounded like the perfect solution to my problem. There were two concerns with the heater belt:

  • Could I use a heater belt with a plastic drum?
  • How fast would it heat the water?

Using the Heater Belt with a Plastic Drum

In the interest of full disclosure, I first bought a metal 55 gallon drum and a metal-drum heater belt. Unfortunately, the metal drum really began to corrode, and the rusty smell and appearance of the water was drag. That is when I switched to a plastic drum. I had seen a plastic drum heater. It was very similar to a metal drum heater, but with a large metal band around it to spread the heat out. The plastic drum heater was much more expensive than the metal drum heater, and I already had a metal drum heater. So I took my plastic drum, bought a $5 roll of aluminum tape (the kind used on ducts) and I wrapped the middle of my plastic barrel with the tape (see figure below). I made the tape layer much wider than the heater belt to spread the heat out. It has worked well.

How fast will the Water Heat?

The belt is powered from a 120 V outlet (standard US voltage) and puts out 1500 W. Because the belt wraps around the outside of the barrel, some of the heat is lost to the environment. This makes heating the barrel a bit inefficient, but workable for my needs.


{t_{Heat}} = \frac{{V \cdot \rho  \cdot \kappa  \cdot \left( {{T_{Desired}} - {T_{Lake}}} \right)}}{{k \cdot R}}

where

  • TLake is the temperature of the lake water (assume 55 °F for a spring or fall temperature)
  • TDesired is the temperature we want for showering (105 °F)
  • \rho is the density of water (1 gm/cm3
  • \kappa is the specific heat of water (4.187 J/gm °C)
  • R is the rate of heat generation (1500 W)
  • k is the efficiency of heat transfer from the barrel to the water (75% a guess)
  • tHeat is the time to heat the water to TDesired from TDesired.

Plugging all these numbers into the equation gives me ~5 hours, which is about what it actually takes during the cold times with a large number of people. During the warmer times with fewer people at the cabin, I cut the amount of water in the drum. This reduces the heating time to a couple of hours. All these numbers have proven manageable.

Designing the Shower

Nothing real sophisticated here. I put together a quick water pump/shower system with the following equipment:

  • a 12 V DC recreational vehicle water pump
  • a 12 V power source, something nice and safe. The safest is a battery, but that needs to be charged. There are numerous 12 V power sources on the market.
  • some garden hose
  • a shower nozzle that screws on the end of the garden hose (any hardware store has this nozzle).

I'm not a plumber but I did manage to find a Brisbane blocked drain plumber that could also help me with a hot water system. I don't have much experience with hot water systems so it was great that I found a plumbing company that could help. The whole thing wouldn't have been possible without them! I made the shower enclosure out of some landscape fencing material that I found cheap at a Home Depot. Obviously, if I was living somewhere less primitive and not doing everything in my power to keep costs down, I'd definitely be putting more thought into the shower design, perhaps with a bit more of an enclosure and privacy than the fencing material with these rimless shower doors. For now, though, we're content with our shower space. The completed shower assembly can be seen in the photo below.

Removing the Gray Water

The procedure here was straightforward as well. Here is what I did:

  • Built the floor base Durock (Durock is a common wallboard used for showers)
  • Cut a drain hole in the Durock and put in a floor drain I picked up from the hardware store
  • Coated the Durock with waterproofing paint mixed with sand
  • Connected up 30 feet of flexible drain tile to the floor drain.
  • Buried the drain tile on a downward slope (my whole cabin sits on sand)

The whole shower has been working now for at least 5 years and still looks good. I have included photos of the shower hardware and the shower enclosure. Of course, I did have the dream of surrounding the shower with some beautiful glass doors, but it just wasn't practical outside. I had the vision of using glass doors when my friend told me about somewhere like this Portland glass service that offered the most beautiful selection. I guess I'll just have to incorporate this in my bathroom design instead. I'm just glad that the shower already functions well with the items I selected; it's a huge weight off my mind. It functions well and it makes living at the cabin a bit more comfortable.

Mechanical Hardware for the Lake Water Shower

Mechanical Hardware for the Lake Water Shower

Shower Enclosure

Shower Enclosure

Posted in Cabin, Construction | Tagged , | 2 Comments

Old Farmer Science - Hay Fires

Introduction

Yesterday, my wife and I went to dinner with a couple that are our neighbors. During our dinner conversation, my neighbor's wife mentioned that she had been listening to radio and had heard a story about a local barn that was full of hay catching fire. She asked me if I knew anything about how hay can catch fire. That simple question really brought back some old memories of my father and grandfather – these memories always make me smile. So I started to tell her all about hay fires ...

Barn Fires

Back in the early 1960s, my father and his four young sons spent a lot of time in a 1956 Chevy Belair driving country roads to and from the old family farmstead. Grandpa was old and sick at this time, and my uncle Harvey had taken over the family farmstead. My father liked to help his brother out with the farm work on the weekends. On the drive to the farm, it was not uncommon for us to see the remains of someone's barn smoldering. Occasionally, we even saw the barn ablaze, which is probably why some people today opt for a metal barn instead of a wooden one. They are currently very popular among farmers, as well as anyone else who is looking to construct a new building for their particular needs. An added benefit of this option is that you will have access to cheap metal buildings that so many companies can offer you these days. This ultimately means that you will have a barn that is very unlikely to burn down from a fire, as well as one that doesn't throw you out of pocket. It's a win-win.

As such, some may look to places that sell these types of barns similar to Tassie Sheds who provide Quality Sheds and barns. One day I asked my father and grandfather what caused these fires. Their answer was interesting.

Spontaneous Combustion

In many ways, a barn's haymow is a very big compost pile. When you put together organic material , moisture, and a little heat, you will get bacterial fermentation. Fermentation produces heat that can cause spontaneous combustion and a barn fire under the proper conditions.

Prevention

Dad and Grandpa were pretty proud of the fact that they had never had a barn fire. They told me that to avoid barn fires, you have to follow "the rules":

  • Do not put hay into the barn wet.
  • Occasionally drive a pipe into the haymow, attach a thermometer to a string, drop the thermometer on the string down the pipe, and measure the temperature. If the temperature exceeds 180°F, the hay has got to be removed from the barn.
  • Be careful when you remove the hay – the hot hay can burst into flame when it is exposed to the air.

All I can say is that their rules must have worked. They never had a barn fire.

Modern Information

When my wife and I returned from dinner, I thought I would look up some modern information on hay fires and see if anything had changed. It turned out that not much has changed. But there are some additional details that are worth mentioning.

  • As the temperature rises, the most common bacteria die off. However, in some cases there are heat-loving bacteria (known as thermophiles) present. If they are present, an unstable situation occurs. More heat cause more bacterial growth, which results in even more heat and bacterial growth.
  • The reaction rate doubles for every 10°C rise in temperature. For those of you chemistry fans, this is a great example of the Arrhenius equation in action.
  • The exponential growth rate of the reaction with temperature means that the reaction can very quickly get out of control.

The following critical temperatures are listed in a Wikipedia reference.

  • 150 °F (65 °C) is the beginning of the danger zone. After this point, check temperature daily.
  • 160 °F (70 °C) is dangerous. Measure temperature every four hours and inspect the stack.
  • At 175 °F (80 °C), call the fire department. Meanwhile, wet hay down and remove it from the barn or dismantle the stack away from buildings and other dry hay.
  • At 185 °F (85 °C) hot spots and pockets may be expected. Flames will likely develop when heating hay comes in contact with the air.
  • 212 °F (100 °C) is critical. Temperature rises rapidly above this point. Hay will almost certainly ignite.
Posted in Farming | 3 Comments

The Mathematics of Dieting - Part 2 (Cholesterol)

Cholesterol and Me

I actually have never had a cholesterol level that would be considered high. The threshold for a high total cholesterol level is generally considered to be anything above 200 mg/dL. Prior to taking a statin to lower my cholesterol level, my highest total cholesterol level was 180 mg/dL. However, my father died at 45 from a heart attack and that means that I have a family history of heart disease. So my doctor recommended that I work to lower my total cholesterol level. I have taken his recommendation seriously. Prior to starting my diet, my cholesterol level while on the statin was 120 mg/dL. After my diet, it has been measured 3 times between 70 mg/dL and 80 mg/dL. In fact, my life insurance company complained that my cholesterol is now too low. I cannot win. There are many things that can be done though to help you with your health. Especially where your cholesterol levels are concerned. For example, some people find that taking rosuvastatin can be helpful. You can learn more about crestor generic and rosuvastatin by visiting the Blink Health website. Diet and exercise are also important, but another thing that you could do would be to just get a good night's sleep. If you struggle to fall asleep quickly then one thing you could do would be to get yourself a new mattress. Why not check out something like this memory foam mattress here?

In my youth, I used to actually make money from cholesterol. When I was in college, I worked as a technician at a college chemistry laboratory. One of my many jobs was to grind up gallstones from a local hospital for use in organic chemistry labs as a source of cholesterol. I was amazed at how large some of the gallstones could be. They must have hurt pretty bad!

Typical Gallstones (Source: Wikipedia)

Typical Gallstones (Source: Wikipedia)

I first got interested in how my cholesterol level was calculated when I noticed that my total cholesterol level was not equal to my HDL plus LDL. A little research soon showed that triglycerides were involved in the equation. I will have more to say about this later in this post.

Measuring Your Cholesterol Level

Most people have had a fasting cholesterol test. A routine fasting cholesterol test measures three things:

  • Total Cholestrol (TC)
  • Triglycerides (TG)
  • High-Density Lipoprotein (HDL) cholesterol

People often refer to HDL as "good cholesterol" and LDL and "bad cholestrol." Your Low Density Lipoprotein (LDL) cholesterol normally is not measured directly. It is calculated using the Friedewald formula.

LDL = TC - HDL - \frac{{TG}}{5}

You can google "Friedewald" about this formula and you will find a number of web sites that criticize the accuracy of this formula (e.g. Wikipedia entry on Friedewald Equaton or this blog post). The criticism center on errors that are present for folks with high triglyceride levels (greater than 400 mg/dL). As often occurs, there are competing regression equations that are claiming superior results (e.g. "Iranian" formula).

There are also some folks who claim the Freidewald formula is inaccurate for people with low total cholesterol levels. Take a look here for a start. Many of the web references state that the problem with both the Freidewald and Iranian equations are that they were developed from data gathered from people with high cholesterol levels. I will leave it to the specialists to argue these points. I will only address what my doctor does. He is a good guy and I trust him.

Cholesterol Metrics

My doctor sends me a report with a number of cholesterol metrics on it.

  • Total Cholesterol (goal is less than 200 mg/dL)
  • HDL Cholesterol (goal is greater than 40 mg/dL)
  • Calculated LDL Cholesterol (goal less than 100 mg/dL)
  • Cholesterol HDL Ratio (goal of 4 or less)

Let's walk through one of my pre-diet test results to illustrate what they report. I am using my pre-diet results because they are closer to what most people see.

ParameterValue

My Cholesterol Test Results
Total Cholesterol 118 mg/dL
Triglycerides 88 mg/dL
HDL 27 mg/dL

Given this data, you can duplicate my doctor's LDL calculation using the Freidewald formula.

LDL = 118\frac{{{\text{mg}}}}{{{\text{dL}}}} - 27\frac{{{\text{mg}}}}{{{\text{dL}}}} - \frac{{88\frac{{{\text{mg}}}}{{{\text{dL}}}}}}{5} = 73\;\frac{{{\text{mg}}}}{{{\text{dL}}}}

The calculation of my cholesterol ratio can be reconstructed as shown below.

\frac{{{\text{TC}}}}{{{\text{HDL}}}} = \frac{{118\frac{{{\text{mg}}}}{{{\text{dL}}}}}}{{27\frac{{{\text{mg}}}}{{{\text{dL}}}}}} = 4.4

Since this old test, I have increased my HDL into the mid-30s and reduced my total cholesterol into the mid-70s. I am afraid that I will always struggle with getting my HDL above 40. I have not given up, but I have not been able to increase this number into the 40s yet.

My Personal Experience with Diet and Cholesterol

I know of a number of people who are trying to control their cholesterol through diet alone. A quick summary of my experience would be:

  • Atkin's Diet: I tried this diet for awhile, but I could not stay on it. However, while on it I had great HDL levels. I discussed this with my doctor and he commented that he had seen similar results with other patients who were on the Atkin's diet. However, this diet simply was not workable for me.
  • Niacin supplements: I and a co-worker have both tried this. He had a problem with "flushing." In both of our cases, niacin had minimal impact on our HDL levels. It can be worth understanding how to get rid of gallstones naturally. So you have another option if the previous supplements don't work for you.
  • Exercise: I have had the most long term success with exercise. It took some time, but daily aerobic exercise is now part of my life. I actually do not feel right when I miss an exercise session. Everyone has different ways of exercising, I have friends who love basketball and go out for it daily. And I have other friends that prefer to take Tennis Lessons once or twice a week. So long as you're getting regular exercise you'll be doing your body the world of good.

Disclaimer

I am not a doctor, just a person interested in my health. See your doctor for advice about your particular situation.

Posted in Dieting, Health | 1 Comment

Max Planck was Nice Guy

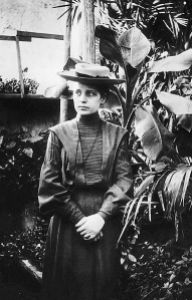
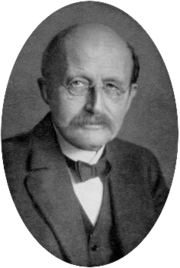
I am reading a great book called "Plutonium: A History of the World's Most Dangerous Element" by Jeremy Bernstein. The history of plutonium has been touched by many of the greatest minds in physics. One of the more intriguing people in the book is the physicist Lise Meitner. Because of gender discrimination, she had to battle to become a physicist. Her mentor, Max Planck, is considered today to be the founder of quantum mechanics and was one of the world's leading physicists when Lise was a student in the early years of the 20th century. His work is honored by physicists today with the term "Planck's constant," a number that relates the frequency of a photon to its energy.

Lise Meitner - Pioneer in the Physics of Fission (Source: Wikipedia)

Lise Meitner - Pioneer in the Physics of Fission (Source: Wikipedia)

Max Planck - 1918 Physics Nobel Prize Winner

Max Planck - 1918 Physics Nobel Prize Winner (Source: Wikipedia)

During a time when gender discrimination was rampant in physics, Planck took the unusual step of allowing Meitner to attend his lectures and later made her his assistant. Bernstein comments that "[Planck] was probably the most important physicist in Germany. He was also a very decent man." I have another Max Planck story that I have never seen in print that also describes what a decent man he was.

I went to North Hennepin Community College for my first two years of college. I still think of this school fondly as providing me the two best years of education that I ever had. One of the physics professors, Roger Johnson, invited me to attend the 1976 Nobel Conference at Gustavus Adolphus University. These conferences are held annually. For a kid from "Small Town USA," this was a big deal. One of the lectures there was given by Victor Weisskopf, an important contributor to the development of quantum mechanics. He told many stories about all the big personalities in physics during the early 20th century when quantum mechanics was being developed. One story he told was about a letter he sent when he was twelve to Max Planck. As a boy, Weisskopf loved science and was looking for career guidance. He had written the letter to Planck in a tone that was much like a young person today might write to their favorite athlete or singer. He said that Planck responded back to him with a very kind letter of encouragement. Weisskopf then wondered out loud how many of the world's leading physicists today would respond similarly to a young man's fan letter. I found Weisskopf's telling of this story to be very touching and that is why I have remembered it over all these years.

Weisskopf also had a story about Wolfgang Pauli that was pretty cute. Pauli was one of great physicists of the 20th century ("Pauli Exclusion Principle"), and he was famous for being a tough customer. When Pauli was hiring assistants, he chose Weisskopf over Hans Bethe. Bethe later became a physics powerhouse – Freeman Dyson referred to Bethe as the "supreme problem solver of the 20th century." Weisskopf said that when he presented his first work to Pauli, Pauli's only response was "I should have chosen Bethe." Weisskopf laughed when he told the story, but I am sure it hurt at the time.

Posted in History of Science and Technology | Comments Off on Max Planck was Nice Guy

Designing A Stairway For My Cabin

I live in Minnesota, where owning a cabin on a lake in the northern half of the state is part of the culture. Here is a picture of my little piece of northern Minnesota.

My Little Northern Minnesota Cabin

My Little Northern Minnesota Cabin

My cabin sits on a small hill about 15 feet above the lake. Unfortunately, the hill is rather steep and a bit difficult to negotiate, particularly for the older folks. At this point, there is only a dirt path up the hill. To add to the difficulty, the dirt path is strewn with rocks and tree roots that make it even more difficult to scale. We thought about looking for a cabin in another location, we even found prefab cabins for sale online, but decided against it when we started talking about making our cabin more accessible.

One of my friends lives in Australia and has recently had a small granny flat built on his property and is also currently in the process of making it more accessible for his elderly relatives. He originally was going to build a cabin, but decided to upgrade to a granny flat instead. There are a fantastic range of cheap granny flats out there, so if you are thinking of building one on your land, make sure to do some research to ensure you get the best deal for your money.

As for my cabin though, I need to build a stairway between the lake and the top of the hill. This project is quite different from building a staircase indoors. In all honesty, I'd probably just use a professional like Pear Stairs if it was! Since summer is just about over and I do not use the cabin in the winter (brrr!), this will be a project for next spring. This means that I have some time to design the stairway. I will have several blog post on this design effort. For today, I will be looking at the basic design equations for a simple, straight flight of stairs.

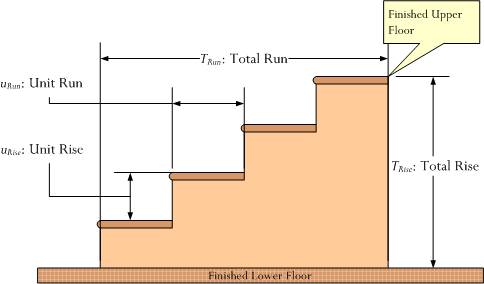
Let's begin by illustrating four key stair terms using the following figure.

Illustration of Some Key Stair Design Terms Used in This Blog Post.

Illustration of Some Key Stair Design Terms Used in This Blog Post.


The definitions of these four terms are given in the following list.

  • TRise : Total Rise – The total (finish floor-to-finish floor) height of the stairs.
  • TRun : Total Run – The total horizontal distance occupied by the stairs.
  • uRise : Unit Rise – The rise of a single step of the stairs.
  • uRun : Unit Run – The horizontal distance occupied by a single step of the stairs.

The Stair Design Process

The basic process of stair design is straightforward.

  1. Measure the Total Rise
  2. Calculate the Number of Risers
  3. Calculate the Unit Rise
  4. Calculate the Unit Run
  5. Calculate the Total Run

Measuring the Total Rise

The total rise of stairs is the one stair parameter that is generally fixed right from the start. However, there is some room for error. While the rough flooring-to-rough flooring height is fixed, the steps must be designed to provide equal riser heights after the finish floors are installed. This means that you have to obtain accurate estimates of the heights of the finish floors at both the lower and upper levels of the stairs before they are installed.

We can illustrate the measurement and estimation processes using the following figure.

Estimating Finished Floor-to-Finished Floor Height

Estimating Finished Floor-to-Finished Floor Height

We can compute the finished floor-to-finished floor height, TRise, using the following equation.

{T_{Rise}} = {T_{RoughRise}} + {\tau _U} - {\tau _L}

where TRoughRise is the rough floor-to-rough floor height, \tau_U is the thickness of the upper finished floor, and \tau_L is the thickness of the lower finished floor.

Calculating the Number of Risers

Most cities are adopting the International Residential Code (IRC) for the construction of single-family residences (often with some modification). This code states that the maximum riser height is 7.75 inches. However, I personally find a riser height of 7.75 inches to be rather high (some local areas allow a unit rise as high as 8 inches). A good nominal maximum for most people is 7 inches, though a shorter maximum may be more appropriate for facilities occupied primarily by children or the elderly. The IRC has no minimum riser height – it allows all the way to zero (i.e. a ramp).

N = \text{ceiling} \left( {\frac{{{T_{Rise}}}}{{7{\text{ inches}}}}} \right)

where N is the number of steps and ceil is the ceiling function, which always rounds up. This approach ensures that unit rise is always less than or equal to 7 inches.

Determining the Unit Rise

Once you have N and TRise, determining the unit rise is easy.

{u_{Rise}} = \frac{{{T_{Rise}}}}{N}

For ease of measurement, you may wish to round the final result to a value that is convenient to measure (e.g. a multiple of 1/8 of an inch).

Determining the Unit Run

Determining the unit rise seems to be confusing to folks. I believe this is because there are some options as to how you compute it. There are three commonly used equations for calculating uRun given uRise, which I list below.

Equation 1: {u_{Run}} = k - {u_{Rise}}{\text{, where 17}} \leqslant {\text{k}} \leqslant {\text{18}}
Equation 2: {u_{Run}} = k - 2 \cdot {u_{Rise}}{\text{, where 24}} \leqslant {\text{k}} \leqslant {\text{25}}
Equation 3: {u_{Run}} = \frac{k}{{{u_{Rise}}}}{\text{, where 74}} \leqslant {\text{k}} \leqslant {\text{75}}

The equations may appear complicated but really they are simple. Basically, you select a uRun that makes at least one of the equations true. The range of k values allows you to use values for the unit rise and unit run that are convenient to measure (e.g. multiples of an 1/8 or 1/4 inch).

These three equations actually produce similar results. To illustrate this point, consider the following graph. I made the graph by setting k equal to the mid-point of its allowed range for each of the equations.

Graph of Stair Angles Versus Equations and Riser Height

Graph of Stair Angles Versus Equations and Riser Height

There are a few points that are worth making about the graph:

  • The stair angles range from 30° to 44°.
  • Equation 1 produces a stair angle that is less steep than the other equations for unit rises greater than 7 inches.
  • Equation 2 and 3 produce stair angles that are less steep for unit rises less than 7 inches.

At a unit rise of 7 inches, all the equations produce stairs with the same angle or slope. At all other unit rises, each of the equations produces slightly different angles. The differences in angles can be useful when trying to fit a stairs into a specific total run.

Determining the Total Run

Once we have uRun, determining the total run of the stairs is straightforward.

{T_{Run}} = N \cdot {u_{Run}}

The total run of stairs is important because it tells you how much of your lower level space the stairs will require. There frequently is some iteration required to get a workable combination of unit rise, unit run, and total run that fits in the allotted space and people can comfortably climb.

Conclusion

This blog post covered the basic math. Real stairs usually include some complications. For example, the IRC does not allow you to have a stairs with more than 18 steps without a landing. This requirement will figure prominently in my cabin stairway. In one of my stair blog posts to come, I will go through the actual numbers associated with my cabin stairs.

Posted in Construction | Tagged | 7 Comments