Distibution of Catholics Around the World

Introduction

I am showing one of my sons how to use Excel pivot tables, so I am looking for good data analysis examples that illustrate the power of pivot tables. The election of a pope has put Catholicism in the news. The news reports have included numerous discussions about the number of Catholics. I was reading a report on the web by the BBC on the distribution of Catholics around the world that used Figure 1.

Figure 1: BBC Representation on the Distribution of Catholics.

Figure 1: BBC Representation on the Distribution of Catholics.


I found this graphic interesting. I was surprised at the number of Catholics in Latin America. I started to wonder if I could generate that chart in Excel. Let's get to work ...

Background

The BBC web site says that the data came from the World Christian Database, which requires membership to get their data -- I need to go look elsewhere. It turns out that similar information can be obtained from the Catholic Hierarchy website. Since the databases are different, I would expect to have somewhat different charts. Hopefully, they will be very similar.

Analysis

My analysis process is straightforward:

  • Import the web data into Excel
  • Assign the countries to the regions used by the BBC
  • Create a pivot table of the data
  • Create a pivot chart of the data

After going through this process, I obtain Figure 2.

Figure 2: My Version of the BBC Graphic.

Figure 2: My Version of the BBC Graphic.


This is pretty close to the graphic presented by the BBC. For those who are curious, I have attached my spreadsheet here.

Conclusion

My chart and the BBC's charts are very similar. This was a good example of a common type of pivot table analysis. I have no doubt that the BBC did something similar to produce their graph.

Posted in General Mathematics | Comments Off on Distibution of Catholics Around the World

A World War 1 Mechanical Torpedo Fire Control Computer

I have discussed the basic calculations behind firing "straight-running" torpedoes in other posts (here, here, and here). Youtube has a couple of interesting videos showing a basic mechanical torpedo fire control computer from World War 1. It is a nice illustration of the geometry that I discussed in my previous posts on this topic. For those folks who are interested in naval history, I do recommend the Dreadnought Project website. The dreadnought folks do amazing work.

Posted in History of Science and Technology, Underwater | 1 Comment

Hometown Humor

Figure 1: Kevin Kling.

Figure 1: Kevin Kling.

My brother called the other night and said that he was going to attend a live show with Kevin Kling, a well-known comedian we grew up with in Osseo, Minnesota. In my youth, Osseo was a small agricultural community on the outskirts of Minneapolis. Growing up in a small town like Osseo was a lot of fun -- we always compared it to Mayberry on the "The Andy Griffith Show." Osseo may be only 0.75 square miles in area, but it would be hard to imagine a place with more interesting people per square foot. I could tell many stories about life there, however, a math blog is not the appropriate place.

If you want to have an enjoyable time listening to reminiscences, I highly recommend that you listen to Kevin Kling and his stories. He has made his living telling stories about growing up during the 1960s in Osseo area. I laugh just thinking about that time. I remember sitting in class with him and listening to his stories -- and now the entire country gets to hear them! I know every person that he is talking about and his description of them is spot on. His stories range from his first love (Judy Martinez, who lived just a few blocks away from me) to his description of watching the "smutty movies" at the Starlight Drive-in Theater from outside the beat-up wooden fence (e.g. Seventeen and Anxious). Those movies were terrible ...

If you want a quick introduction to Kevin, he was interviewed on the radio program "Speaking of Faith" and it is a worthwhile listen.

Posted in Osseo, Personal | Comments Off on Hometown Humor

Spline Interpolation Example Using Battery Capacity

Introduction

I had a conversation with a customer recently who wanted to estimate the capacity and running time of their electronic systems when operating from batteries that are under various current load and temperature stresses. The battery manufacture had only specified their battery's operation under a limited number of usage scenarios-- none of which corresponded to those of my customer. To provide some guidance to this customer, I needed to do some interpolation of the battery vendor's data. This was an interesting exercise and thought it was worth sharing my work here.

Background

Figure 1 shows the battery data that I will be interpolating. This data is from the specification here.

Figure 1: Battery Vendor Data for the Panasonic LC-R127R2P Sealed Lead Acid Battery.

Figure 1: Battery Vendor Data for the Panasonic LC-R127R2P Sealed Lead Acid Battery.

Normally, I use Mathcad for this kind of work. In fact, I had done this work originally in Mathcad years ago. However, this particular customer only had Excel -- sigh. After a Google search, I found an excellent VBA-based, cubic spline routine by David Braden. A little Excel and a little VBA soon gave me a spreadsheet that would interpolate Figure 1 adequately.

Analysis

Analysis Approach

  1. Generate a linear approximation of the discharge curves on the vendor's graph

    The chart shows that the "curves" are linear on a log-log plot over the range from 0.4 A to 10 A. I will do a least-square line fit over that range of currents at four temperature values: -15 °C, 0 °C, 25 °C, and -40°C. This operation will generate four slopes and intercepts.

  2. Use the cubic spline routine to interpolate between the slopes and intercepts from part 1 for any temperature between -15 °C and 40 °C.

    This is a reasonable approach to estimating the line parameters at temperatures presented on the battery's specification sheet.

  3. Assign two cells for the manual input of currents and temperatures by the customer.

    This allows me to compute the backup time duration of the battery for a specific set of conditions.

  4. Compute the effective battery capacity by multiplying the current draw by the time duration.

    Many people prefer to think in terms of battery capacity and not operating time. I am just applying the definition of battery capacity to compute a value.

  5. Use Excel data tables to generate a chart and a couple of tables.

    Excel data tables are an excellent way of generating graphical and table data for a wide range of one and two-dimensional inputs.

The Excel file that I put together is available here.

Interpolated Results

My customer is normally running his batteries at a current load of 0.8 A. Figure 2 shows the worksheet output for 0.8 A load and variable temperature.

Figure 2: Interpolated Battery Capacity Versus Temperature @ 25 °C.

Figure 2: Interpolated Battery Capacity Versus Temperature @ 25 °C.

The customer also requested data in table form. Figure 3 shows a table of discharge times versus various temperatures and current loads.

Figure 3: Discharge Times Versus Load Currents and Temperatures.

Figure 3: Discharge Times Versus Load Currents and Temperatures.

Figure 4 shows a table of effective battery capacities (A-hour) versus various temperatures and current loads.

Figure 4: Effective Battery Capacity Versus Various Battery Loads and Temperatures.

Figure 4: Effective Battery Capacity Versus Various Battery Loads and Temperatures.

Conclusion

I thought this was a good example of the use of interpolation in a real world setting. Hopefully this example will be of use to you.

Posted in Batteries, General Mathematics | Comments Off on Spline Interpolation Example Using Battery Capacity

Battery Life Dissipated Under Varying Temperature Conditions

Introduction

I am not getting any younger. As I age, I have come to realize that certain activities age me faster than others. For example, I have no doubt that sitting in meetings for hours every day has deleterious effects on my health. In the case of batteries, higher temperatures age batteries faster than lower temperatures. This post works through two examples in detail to illustrate how to model the rate of battery aging under varying temperature conditions.

I am usually asked about battery life aging with respect to two types of temperature profiles: (1) a battery operating at a few discrete temperatures and (2) a battery operating at a continuously varying temperatures. The analysis methodology is the same in both cases. I will provide examples of both cases.

Background

General Battery Aging Model

I have written extensively about battery aging models in other posts (e.g. here). In those posts, I assumed that the battery temperature was constant. I recently had a customer request that I analyze the impact of varying temperature on a battery's life. This problem was interesting enough that I thought it was worth documenting here.

I will be using the model of IEEE 450-2002 for this post. For those of you in need of a review, take a look here. For another reference, McCluer's paper also uses the same approach.

Computational Model

Every lead-acid battery vendor specifies the expected lifetime of their battery. Most of these batteries have 3 to 5 year lifetimes at 25 °C. However, some batteries are rated to have lives as long as 12 years at 25 °C. In this post, I will compute a conversion factor that will adjust the vendor's specified lifetime for a non-constant temperature profile.

I have done these calculations a couple of different ways. I have estimated battery life using two approaches:

Equivalent 25 °C Time

Express battery life in equivalent 25 °C days. I do not like this approach myself, but some customers will tell me that their operational model requires an 8 year life for a specific temperature profile. They then want to compute an equivalent lifetime at 25 °C, which is how the battery manufacturer's specify their products.

Actual Time

Express battery life in actual days using the customer's temperature profile. I prefer this approach because I generally know the battery that is going to be used and I want to estimate this batteries life under the customers temperature profile.

My approach is simple:

  • Determine the customers temperature profile

    Sometimes the customers gives you their profile and sometimes they tell you that they are doing a deployment in a certain community, like Phoenix (a case that I studied for this very reason).

  • Express the customer's temperature profile in terms of temperature versus percentage of time at that temperature.

    We are going to be computing a weighted average and we need to know the percentage of time the battery spends at each temperature.

  • Compute a conversion factor between 25 °C time and customer profile time.

    Knowing the equivalence between the different temperature profiles (e.g. customer profile versus constant 25 °C), we can generate terms of equivalent 25 °C days or actual days.

Equation 1 shows how I plan to use the conversion factor to adjust the battery's rated lifetime.

Eq. 1 {{T}_{Life\_Profile}}=\frac{{{T}_{Life\_At\_25{}^\circ C}}}{K}

where

  • K is the nominal lifetime conversion factor [unitless]
  • TLife_At_25°C is the battery manufacturer's rated lifetime for the battery at a reference temperature (usually 25 °C) [years]
  • TLife_Profile is the estimated battery lifetime for the customer's temperature profile [years]

For the case of the temperature holding a finite number of discrete values, Equation 2 can be used to compute the conversion factor.

Eq. 2 K=\sum\limits_{i=1}^{N}{\frac{ t{{\%}_{i}}}{A({{T}_{i}})}}

where

  • K is the nominal lifetime conversion factor [unitless]
  • Ti is the temperature during the ith time interval [°C]
  • t%i is the percentage of the battery lifetime at a temperature of Ti [hours]
  • A(Ti) is aging function that corresponds to the battery in question [unitless]

For the case of a continuously varying temperature environment, Equation 3 must be used.

Eq. 3 K=\frac{1}{{{\tau }_{0}}}\cdot \int\limits_{0}^{{{\tau }_{0}}}{\frac{dt}{A(t)}}

where

  • ti is time [hours]
  • τ 0 is the interval of integration over the profile time [hours]
  • T is the duration for the application of the temperature profile [hours]
  • K is the duration of the time interval with a temperature of Ti [hours]

You can view dt/{{\tau }_{0}} as representing the percentage of time represented by a differential length of profile time. As in the discrete case, you can view this as the computing of a weighted average.

Analysis

Discrete Temperature Distribution

Figure 1 shows my evaluation evaluation of Equation 2 for the discrete temperature profile used in the paper by McCluer. I obtained his result, so I have verified my Mathcad implementation.

Figure 1: Analysis of a Discrete Temperature Distribution.

Figure 1: Analysis of a Discrete Temperature Distribution.

Continuous Temperature Distribution

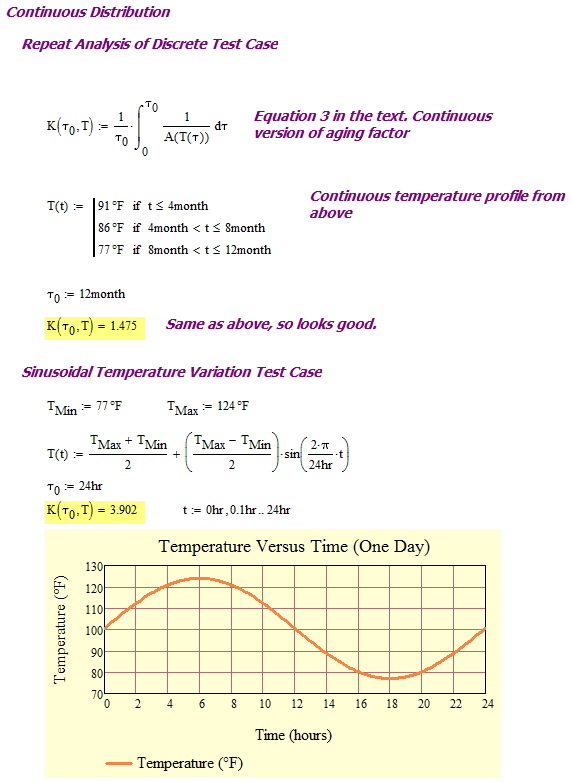
Figure 2 shows my evaluation of Equation 3 for a both the discrete temperature profile used in McCleur's paper and for a continuous temperature variation based on a sine wave (I could have used anything). I am assuming that every day has the same temperature variation. Thus, the percentage of time spent at each temperature is the same for each day and for all the days in total. If I wish to use a period of time longer than a day, I simply extend my interval of integration over the period of time desired.

Figure 2: Aging Analysis for a Continuous Temperature Variation.

Figure 2: Aging Analysis for a Continuous Temperature Variation.

Conclusion

I recently went through this exercise while assisting a customer in a desert climate. They were trying to estimate the effect of temperature on their battery replacement costs. My analysis gave them a rationale approach for determining their operational costs.

Posted in Batteries, Electronics | 1 Comment

Asteroid Belt Mass Distribution Analysis

Introduction

The meteor explosion over Russia really interests me and I have been reading as much about it as I can. While reading about meteors and asteroids, I encountered the following statement.

The total mass of the asteroid belt is estimated to be 2.8×10²¹ to 3.2×10²¹ kilograms, which is just 4% of the mass of the Moon.

I like to fact check things I read on the web or in the news. Checking this statement is a nice application of simple data analysis in Excel. Let's do a quick fact check here.

Background

The Wikipedia has a great article on the asteroid belt and I cannot improve on their article for basic information. What I need is data on all the known objects in the asteroid belt. It turns out that the folks at the Jet Propulsion Laboratory (JPL) have a great database of all the known asteroid belt objects. I will use that database to generate a list of all the known asteroid belt objects with a diameter greater than or equal to 1 km. I chose the 1 km lower bound to keep the amount of data small.

Analysis

My analysis is approximate -- think of it as a Fermi problem-type analysis. My analysis approach is simple:

  • Download a paper that contains asteroid densities and compute a weighted average density to use for my analysis -- see the Appendix of this post for my average density analysis analysis
  • Download all the main belt objects with diameters (D) greater than or equal to 1 km from JPL website
  • Determine the volume of each asteroid using the formula M=\frac{4}{3}\cdot \pi \cdot {{\left( \frac{D}{2} \right)}^{2}}\cdot \rho , where ρ is my estimate of the average density of an asteroid (2.46 gm/cm3)
  • Put all the data into a table and sort them by mass
  • Compute the percentage of mass that each asteroid represents in the asteroid belt

Table 1 shows the first 10 entries of my table. There are actually 2039 asteroids in my complete table. Understand that I only have a very approximate analysis here. If you want to see a list of the most massive 18 asteroids using the most accurate numbers known, see the Wikipedia. I have included the whole Excel file in the Appendix for this post.

Table 1: Top Ten Asteroids in Terms of Mass.
Name Diameter(km) Estimated Mass(1019 kg) Main Belt Mass(%)
Ceres 952.40 111.32 41.1%
Pallas 545.00 20.86 7.7%
Vesta 530.00 19.18 7.1%
Hygiea 407.12 8.70 3.2%
Davida (1903 LU) 326.06 4.47 1.6%
Interamnia (1910 KU) 316.62 4.09 1.5%
Europa 302.50 3.57 1.3%
Euphrosyne 255.90 2.16 0.8%
Eunomia 255.33 2.14 0.8%
Psyche 253.16 2.09 0.8%

When I added up all the masses in my list, I got a number slightly less than 4% of the mass of the Moon -- fact confirmed.

Conclusion

I was a bit surprised that the asteroid belt contains so little material. Think about -- the total mass in the asteroid belt is less than 4% of the Moon's mass. That really is not very much.

Appendix

I put my Excel file out here for the curious.

Posted in Astronomy | Comments Off on Asteroid Belt Mass Distribution Analysis

Interesting Historical Note About Cheese

Interesting Historical Note About Cheese

I like blog posts that go into the history of common things. This post does a nice job discussing cheese and its long history.

Posted in General Science | Tagged | Comments Off on Interesting Historical Note About Cheese

Battery Freezing Math

Quote of the Day

The best argument against democracy is a five-minute conversation with the average voter.

— Winston Churchill


Introduction

7.2 A-hr Sealed Lead Acid Battery.

Figure 1: 7.2 A-hr Sealed Lead Acid Battery
(Source). This battery is a workhorse products
for many markets, including telecom and home
security.

I live in a cold climate -- so cold that under certain circumstances we can freeze our lead-acid batteries (Figure 1). A customer who lives in my region called recently and was wondering if I thought any of his batteries would have frozen over the winter. A number of his Internet service subscribers have vacation homes that are unoccupied over the winter. All of these vacation home owners turn off their AC power for the winter. Since all of our Optical Network Terminals (ONT) are connected to Uninterruptible Power Sources (UPS), they will begin operating off of their battery when the AC power goes away. If the home owner does not disconnect the battery, the ONT will run discharge the battery. This is important because a discharged battery will freeze -- a charged battery will not freeze. A battery that has been frozen is very likely a dead battery and you will need a replacement battery.

Note that car and rv batteries rarely freeze because a car and rv battery is rarely fully discharged. These batteries will freeze if they are allowed to get cold enough when discharged. Here is a typical situation:

  • You have a car or rv with remote start and standard electronics. This suite of hardware puts a 100 mA parasitic load on the battery: 70 mA for the remote starter and 30 mA for the car computer.
  • The car or rv is parked in a cold garage for five days.
  • The battery discharges and the battery freezes.

This EXACT situation just happened to my son. He now must ensure he drives the car every few days to keep the battery charged.

Let's examine why my ONT customers need to worry about discharged batteries over the winter.

Background

Lead-acid batteries contain a solution of sulfuric acid (H2SO4) and water -- the solution is referred to as the battery's electrolyte. Adding a solute (in this case, H2SO4) to a solvent (in this case, H2O) will lower the freezing point of a solution. A fully charged battery has more H2SO4 than a discharged battery. The additional H2SO4 depresses the freezing point of the batteries electrolyte to around -70 °C. This is a temperature we do not see in Minnesota. However, a discharged battery's freezing point rises to ~-10 °C. Unfortunately, the temperature in Minnesota frequently drops below -10 °C.

Analysis

This blog post is going to focus on presenting empirical data. However, I do want to spend a bit of time discussing the various ways of expressing the concentration of battery acid.

Battery Acid Concentration

There are three common ways of expressing the concentration of battery acid.

  • Specific Gravity (symbolized by SG)

    Specific gravity compares the density of the battery electrolyte to that of water. Specific gravity is readily measured using a hydrometer, which almost every auto mechanic has used – even I have a hydrometer. I see inexpensive hydrometers for sale every time I go into an automotive parts store.

  • Mass Fraction (symbolized by w)

    The mass fraction expresses the acid concentration in terms of the mass of acid divided by the total mass of the acid -water mixture. This measure of concentration is a convenient measure because only a scale is required to mix up a properly measured solution. Unfortunately, there is no inexpensive instrument for measuring the mass fraction directly after it has been mixed. Once mixed, we use SG.

  • Molality (symbolized by m)

    Molality is the number of moles of solute per kg of solvent. The advantage of using molality as a measure of battery acid concentration is that you can create a properly mixed solution using only a scale. The problem is that there is no readily available instrument for measuring molality after it has been mixed. Again, we usually use SG.

The mass fraction and molality are related by the equation m=\frac{w}{{MM\cdot \left( {1-w} \right)}}, where MM is the molar mass of the solute (98 grams/mol for H2SO4). Specific gravity can be used to relate mass fraction to molarity (symbolized by M) by the equation M=\frac{w \cdot SG\left( w \right)}{MM}, where SG is assumed to be equal to the solution's density (close enough for most applications). I do not see molarity used by battery people, but chemists use it all the time. I cover these formulas in more depth in this post.

Cell Voltages: Open Circuit, Charging, and Discharging

Figure 2 (Source) shows the terminal voltages experienced by "12 V", 6-cell, lead-acid battery when at different levels of charge and discharge currents.

Figure 1: Voltages During Charging and Discharging for a 12 V Battery.

Figure 2: Voltages During Charging and Discharging for a 12 V Battery.

Because of the variation in battery terminal voltage with charge or discharge current, I will plot (Figure 3) the open-circuit terminal voltage. This will make the graph simpler.

Freezing Point and Open-Circuit Cell Voltage Versus Acid Concentration

Figure 3 (Source) shows both the electrolyte's freezing point and the open-circuit cell voltage as a function of mass fraction, specific gravity, and molality. We usually define a fully charged battery has having an electrolyte with a molality of 6.0 moles/kg. Similarly, a discharged battery is usually defined as a battery with an electrolyte having a molality of 2.0 moles/kg.

editedfinal Cell Voltage Versus Specific Gravity3
Figure 3(a): Battery Freezing Point Versus Specific Gravity. Figure 3(b): Cell Voltage Versus Specific Gravity.

Conclusion

I have dealt with this issue for a number of years. I thought it was worth documenting why the UPS batteries can freeze. The solution is simple -- disconnect the charged battery from the UPS. A lot of other things will freeze (e.g. the water/anti-freeze mixture often used to winterize vacation home plumbing) before that charged battery will freeze.

To cross-check my information, I also consulted additional sources, which I document here.

Appendix A: Primary Battery Source Material

In addition to the data presented in Figure 2, I also used the following table from Vinal's "Storage Batteries". (Google Books Reference)

Figure M: Battery Data from Vinal, 1951 (Source).Figure M: Battery Data from Vinal, 1951 (Source).

Figure 4: Battery Data from Vinal, 1951 (Source).

Appendix B: Additional Battery Source Material

I consulted numerous sources to corroborate the data presented here. Figure 5 shows data from Sandia, which has gathered together a surprising amount of lead-acid battery data.

Figure 1: Specific Gravity, Terminal Voltage, and State of Charge Data (Sandia Labs).

Figure 5: Specific Gravity, Terminal Voltage, and State of Charge Data (Sandia Labs). A 12 V battery has 6 cells. To derive the cell voltage, I divided the terminal voltage by 6.

To simplify comparison with Figure 3, I will reformat the Sandia data so that the state of charge and cell voltage are functions of specific gravity (Figure 6).

Figure M: Sandia Data Reformated As Function of Specific Gravity.

Figure 6: Sandia Data Reformatted As a Function of Specific Gravity.

The data in Figure 5 is similar to that shown in Figure 2. Since this is empirical data, I expect some differences between sources. If you are curious about how I generated Figure 5, see the Mathcad and PDF file here.

Figure 6 shows another set of data. This data is also consistent with the other data sets I found.

Figure M: Cell Voltage Versus Specific Gravity and Depth of Discharge (Source).

Figure 6: Cell Voltage Versus Specific Gravity and Depth of Discharge (Source).

Posted in Batteries, Electronics | Tagged , , | 17 Comments

Russian Meteor Characteristics

Quote of the Day

I write a lot of programs and I can’t claim to be typical but I can claim that I get a lot of them working for a large variety of things and I would find it harder if I had to spend all my time learning how to use somebody else’s routines. It’s much easier for me to learn a few basic concepts and then reuse code by text-editing the code that previously worked.

— Donald Knuth


Introduction

Figure 1: Chelyabinsk, Russia shown in red.

Figure 1: Location of Chelyabinsk, Russia, marked in red (Source).

A meteor exploded over Chelyabinsk, Russia (Figure 1), at 3:20 UTC on February 15, 2013. I have been reading accounts of the size, speed, and energy of the meteor. This post presents some simple calculations that verify the consistency of the expert's estimates on the meteor characteristics. Also, I thought it would also be interesting to look at the amount of overpressure required to cause the sort of damage that was seen after the meteor and to include some explanatory material as to how scientists determine the characteristics of a meteor.

Background

Meteor Trajectory

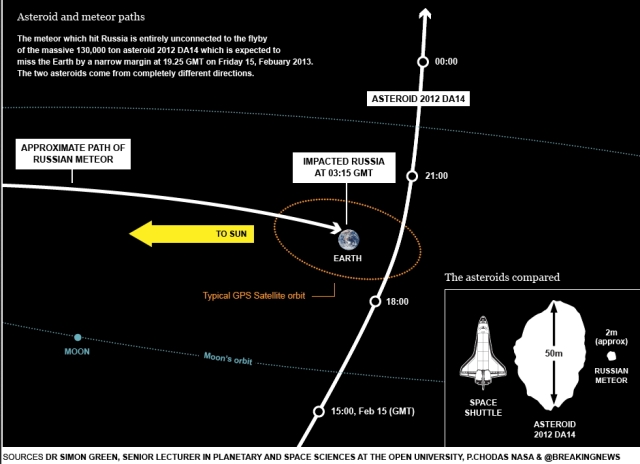
This meteor entered the Earth's atmosphere without warning. There are a number of reasons why it was not detected earlier. One reason is that it came from the direction of the Sun, which generates so much glare that it is difficult to see meteoroids coming in from that direction. Figure 2 illustrates its trajectory (Source). There is a program, called Sentinel, that will be attempting to place a telescope near the orbit of Venus that will allow us to see some meteoroids coming from the direction of the Sun by 2017.

Figure 1: Trajectory of the Russian Meteor.

Figure 2: Trajectory of the Chelyabinsk Meteor.

Coincidentally, asteroid 2012 DA14 passed by 16 hours before. Figure 3 shows another view of the orbits (Source).

Figure 2: Orbits of Asteroid 2012 D14 and the Russion Meteor.

Figure 3: Orbits of Asteroid 2012 D14 and the Chelyabinsk Meteor.

Meteor Characteristics

There are numerous articles quoting different size and energy estimates. If you want to see how these characteristics are determined, see this document on how the meteor characteristics were determined for the Tagish Lake fireball in Canada. It is a bit technical, but does provide a complete description of the meteor analysis process.

For the Russian meteor characteristics, let's work with the press release from JPL. It states that the meteor has the following characteristics:

  • velocity: vMeteor = 44,000 miles/hour
  • mass: mMeteor = 7,000 to 10,000 tons
  • energy: EKE = 500 kilotons

Another press report stated the iron content of the meteor is 10 %, which is consistent with a ordinary chondrite meteor type H. Given this information, we can proceed to cross-check these figures.

Meteor Density

Assuming that the meteor is roughly spherical and we have an estimate of the mass, we can calculate the diameter if we know the density of the meteor. Let's assume the meteor is an ordinary chondrite type H. Figure 4 shows a table that lists density values for the different types of meteors (Source). An ordinary H chondrite type H has an average density of 3.4 gm/cm3.

Figure 1: Density Distribution of Meteorites.

Figure 4: Density Distribution of Meteorites.

Analysis

Meteor Diameter

Using the meteor mass and density numbers from above, we can compute an estimate for the meteor diameter using the approach shown in Figure 5.

Figure 3: Calculations for the Meteor Diameter.

Figure 5: Calculations for the Meteor Diameter.

My estimate of 16.8 meters for the meteor diameter is in the 15 meter to 17 meter diameter range stated in the JPL press release.

Meteor Energy

The Cold War left us with an infrastructure for measuring meteor characteristics as part of the Comprehensive Test Ban Treaty Organization. These folks run a network of sound sensing stations that can detect nuclear blasts. They can also track meteors, which gives us velocity information, and they can estimate the energy of the meteor by the loudness of the explosion. My calculations in Figure 6 show that the reported energy value of 500 kilotons and the meteor's velocity and mass estimates are consistent.

Figure 4: Calculations for the Kinetic Energy of the Meteor.

Figure 6: Calculations for the Kinetic Energy of the Meteor.

You do occasionally hear news about these world-wide sensor networks for monitoring nuclear test ban compliance in contexts other than meteors (e.g. the Vela Incident).

Overpressure

Exploding meteors can have a tremendous amount of energy. This energy can be comparable to that of a nuclear weapon. Like a nuclear weapon, an exploding meteor can generate blast effects due to overpressure. The Wikipedia defines overpressure as

Overpressure (or blast overpressure) is the pressure caused by a shock wave over and above normal atmospheric pressure. The shock wave may be caused by sonic boom or by explosion, and the resulting overpressure receives particular attention when measuring the effects of nuclear weapons or thermobaric bombs.

If you want to get some insight into the power of an air burst with energy comparable to a nuclear weapon, look at the following video of a UK nuclear test for a 1.8 megaton air burst (altitude = 8000 feet) at a range of 20 miles (Figure 7).

Figure 7: First British Nuclear Test.

Since the meteor blew out many windows and did some minor structural damage, we can estimate the amount of overpressure on the ground using data from Table 1 (Source), which gives an idea of the level of damage that can be generate by the overpressure associated with an air burst.

Table 1: Impacts of Peak Overpressure on Buildings and Humans. 
Peak Overpressure (psi) Effect on Structures Degree of Damage
0.15-0.22 Typical window glass breakage Moderate
0.5-1.1 Minor damage to some buildings Moderate
1.1-1.8 Panels of sheet metal buckled Moderate (broken)
1.8-2.9 Failure of concrete block walls Severe
Over 5.0 Collapse of wood framed buildings Severe
4-7 Serious damage to steel framed buildings Severe
6-9 Severe damage to reinforced concrete structures Moderate
10-12 Probable total destruction of most buildings Severe (collapse)

Conclusion

This was just a quick look at some science in the news. For more information on meteor air bursts, see this post.

Posted in Astronomy, Electronics | 1 Comment

Battery Outgassing Math

Quote of the Day

Madam, if you were my wife, I'd drink it!

- Winston Churchill's response to Lady Astor, who had said to him "If you were my husband, I'd poison your tea." Churchill and Lady Astor were famous for their feuding.


Introduction

Figure 1: Aftermath of a Hydrogen Gas Explosion in a Battery Vault.

Figure 1: Aftermath of a Hydrogen Gas Explosion in a Battery Vault.

I recently have received a number of questions about the outgassing of hydrogen gas that can occur from lead-acid batteries when they are being overcharged. I thought it would be useful to review what is happening when a battery is outgassing. When being charged, batteries can release enough hydrogen gas to create an explosive hazard. Consider this report and Figure 1 as an example as to what can happen. With lead-acid batteries, hydrogen gas can be generated at any time, but charging is when the greatest challenges are faced. You may also check this out to learn more about hydrogen gas detection.

Background

Basic Chemistry

When you think about it, a lead-acid battery being charged looks a lot like a water electrolysis setup. You can split water into its hydrogen and oxygen components by applying an electrical potential greater than 1.48 V to water. Figure 2 shows a typical electrolysis setup (source).

Figure 2: Example of an Electrolysis Setup.

Figure 2: Example of an Electrolysis Setup.

Figure 2 also describes a battery being charged -- there are two terminals that are separated by water (plus some H2SO4) and the terminals have a voltage applied to them. Figure 3 shows a cross-section diagram of a lead-acid battery. Figures 2 and 3 are very similar.

Figure 3: Battery Cross Section Diagram.

Figure 3: Battery Cross Section Diagram.

Oxygen is generated at the positive terminal and hydrogen is generated at the negative terminal. Since we normally charge lead-acid batteries at a potential higher than 2.2 V, we always get some electrolysis along with the charging. That is why some batteries need to have their water replenished frequently. Those that do not need to have their water replenished incorporate some mechanism for gas recombination (see AGM and Gel Battery).

Equation 1 shows the basic electrolysis reactions.

Eq. 1 \displaystyle 2{{H}_{2}}O\to {{O}_{2}}\uparrow +4H+4{{e}^{-}} reaction at the positive electrode
\displaystyle 2{{H}_{2}}O+2e\bar{\ }\to ~{{H}_{2}}\uparrow \text{ }+\text{ }2\left( OH \right)\bar{\ } reaction at the negative electrode

How to Abuse a Lead Acid Battery

There actually are standards for how to abuse a battery (i.e. force it to runaway and outgas). The one I am most familiar with is the Induced Destructive Overcharge Test in IEC standard 952-1:1988. Here is a useful reference that discusses how to perform the test.

Example of Battery Abuse

It does not take much searching on the web to find examples of a lead acid battery that has undergone thermal runaway. Figure 4 shows an example of battery damage as the result of thermal runaway. I have seen some cases where the battery case got so hot that it melted.

Figure 4: Example of an Battery That Has Exploded (Wikipedia).

Figure 4: Example of an Battery That Has Exploded (Wikipedia).

Remember that overcharging, outgassing, and thermal runaway are all related. Thermal runaway is not a good thing to have to happen.

Analysis

Battery Example

The discussion that follows is about the Panasonic LC-127R2P 12V/7.2Ah, which is a very commonly used sealed lead-acid battery. I show this battery in Figure 5. This battery is composed of 6 cells connected in series. Each cell nominally generates 2.0 V, but the exact voltage varies with the batteries state of charge and can be anywhere from 1.75 V to 2.25 V when discharging. As this battery is filled with Sulfuric acid, this is a dangerous chemical for anyone to deal with, especially if it is released into the atmosphere. With this being said, it may be worth checking out a site like Storemasta, in the hopes of finding out more about chemical like Sulfuric acid.

Figure 5: Sealed Lead Acid Battery Example.

Figure 5: Sealed Lead Acid Battery Example. This is an AGM (Absorbed or Advanced Glass Mat) battery. The mat is sandwiched between the plates and is saturated with sulfuric acid. The mat retains the acid in the event of a breakage, making the battery spill-proof. You can also get AGM Solar Batteries.

It really is a workhorse product -- I have never had any issue with it. Like all lead-acid batteries, you just need to treat it nicely.

Rate of Outgassing

I thought it would be a good exercise to show how much hydrogen and oxygen a battery can generate. Note that most references focus on the generation of hydrogen because that is the gas that is flammable. IEEE 484 is the standard governing the installation practices for lead-acid batteries and it states that

5.4 Ventilation

... Maximum hydrogen evolution rate is 0.127 mL/s per charging ampere per cell at 25 °C and standard pressure (760 mmHg). The worst-case condition exists when forcing maximum current into a fully charged battery. ...

The hydrogen evolution rate is important to know because the Lower Explosive Limit (LEL) concentration for H2 gas is 4%. Knowing the rate of hydrogen gas generation and the volume of the battery enclosure allows us to determine the amount of ventilation required for an explosion-proof installation. We can show where this result comes from applying a bit of basic chemistry. Figure 6 shows my derivation. In this derivation, I show how to compute the H2, O2, and total gas (H2 and O2) generation rates per cell.

Figure 6: Derivation of IEEE 950 Value for H2 Gas Generation Per Amp of Current.

Figure 6: Derivation of IEEE 484 Value for H2 Gas Generation Per Amp of Current. A Total Gas Volume Value is Also Generated For Comparison with Panasonic Data in Figure 7.

Using the derivation of Figure 6, Equation 2 states the complete equation for the total gas generation rate (O2 and H2) from a battery composed of multiple cells.

Eq. 2 {{R}_{Gas}}={{R}_{O2}}+{{R}_{H2}}=11.4\frac{\text{mL}}{\text{minute}\cdot \text{cell}\cdot \text{Ampere}}\cdot {{N}_{Cells}}\cdot {{I}_{Charge}}

where

  • RGas is the total gas generation rate.
  • NCell is the number of cells in the battery.
  • ICharge is the charging current.

While Equation 2 is stated for the total gas generation rate, the same basic equation form holds for O2 and H2 individually, just change the constant term from 11.4 mL/(min ·A ·cell) to:

  • 7.6 mL/(min ·A ·cell) for H2 generation only
  • 3.8 mL/(min ·A ·cell) for O2 generation only

Empirical Data

Figure 7 shows the outgassing graph for the Panasonic LC-127R2P 12V/7.2Ah Sealed Lead Acid Battery. This graph shows the total amount of gas generated, which means both O2 and H2. You can see from the handwriting on the graph that this is not an official graph -- I got this from an electrochemist with Panasonic who had measured the outgassing characteristic. The little black arrows on the graph indicate which axis the individual curve corresponds to. The x-axis is stated in units of "CA". CA describes the charging current as a fraction of the A-hr capacity of the battery (the A-hr capacity is treated as a current value). Using the 7.2 A-hr battery for an example, 0.1 CA = 0.1 ·7.2 A = 0.72 A charging current.

Figure 7: Hydrogen Gas Emissions from a 7.2 A-hr Sealed Lead Acid Battery.

Figure 7: Hydrogen Gas Emissions from a 7.2 A-hr Sealed Lead Acid Battery.

Figure 7 deserves one other comment -- I have no idea why the battery vendor's electrochemist used a logarithmic x-axis. Gas generation is linear with charging current. The use of a logarithmic axis makes it look like something nonlinear is going on. In the following discussion, I will take the data and re-plot it on a linear graph (Figure 8).

Theoretical Versus Empirical

Figure 8 shows a comparison of the measured gas generation rate versus the predicted gas generation rate. Notice that the theoretical rate is higher than the measured rate. This is because 100% of the charging current into the battery does not go into electrolysis -- some must go into charging. To recover the water lost because of electrolysis, sealed lead acid batteries contain one of two types of gas recombining technology which will ensure that low levels of generated gas will be recombined into water. However, the theoretical rate is useful because it established an upper bound for the amount of H2 that can be generated.

 Figure 8: Comparison of Theoretical Versus Empirical Gas Generation Rates.


Figure 8: Comparison of Theoretical Versus Empirical Gas Generation Rates.

Conclusion

Lead-acid battery outgassing is one of the least understood characteristics of this chemistry. Hopefully this note helps explain how outgassing works and how to estimate the amount of hydrogen generated.

References

Good Paper on Battery Outgassing
Ventilation Example

Save

Save

Save

Save

Save

Save

Save

Save

Save

Posted in Batteries, Electronics | 20 Comments